The point of any long position, just like any relationship, is to move from the lower left to the upper right.
Wolf's Den
Viewing entries tagged
Stock Market
Q4 Recap: IBM beat on Q4 non-GAAP EPS of $4.84 vs the $4.81 Capital IQ Consensus and reported revenues in-line at $22.06 bln.
“I had made a mistake. But where? I was bearish in a bear market. That was wise. I had sold stock short. That was proper. I had sold them too soon. That was costly. My position was right but my play was wrong.”
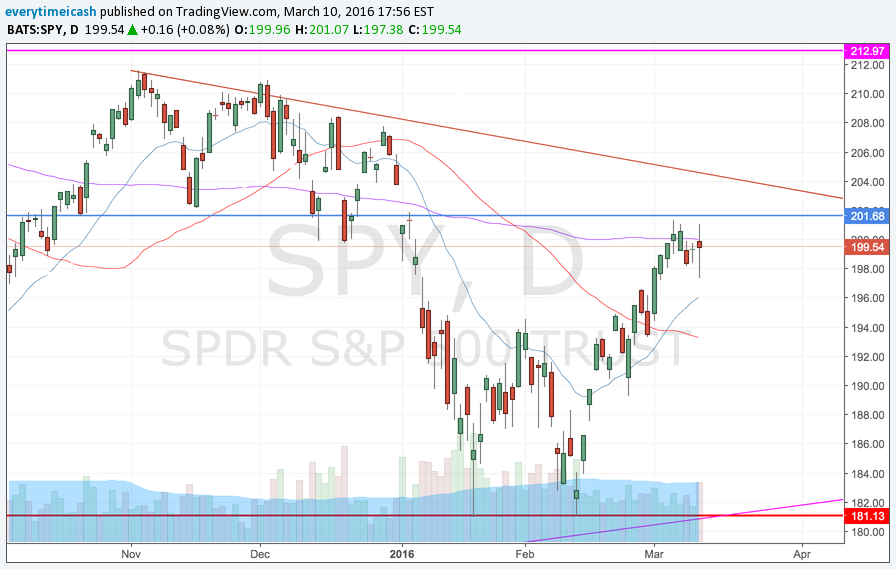
As I write this, the markets have swung from 201 to 197.5ish back to 199 in the SPY. The swings have been wild and back and forth. Bulls will argue that the economy isn't as bad as people are making it out to be and central bankers are on your side (Super Mario). Bears will argue that we've come too far too fast and we're setting up for a violent failure, market breadth is dampened, and leaders/momentum is rolling over.
Well, and I mean this without it being a cop out, both parties are correct in their assessments. We're in a position now in the markets where our accustomed leadership is waining (think #FANG) and the bears have seemingly lost control in the last several weeks. This sets up for one of two possible scenarios;
Well, technically there are three scenarios. But the third scenario is one that will yield back to the first two;
For people like us, this means we're left with limited options. The times of buy and hold are likely over -- at least until further notice. We've got a flat 100MA, 50WK MA 100Wk MA and 200DMA overhead. A literal tug of war between the bear and bull camps. Positions that have been on for years are starting to unwind (#FANG distributed and short covering in depressed energy assets). The moves are subsequently violent as those who look to get out are getting out and those who are finding "value" are getting in for "the next leg" whatever that means.
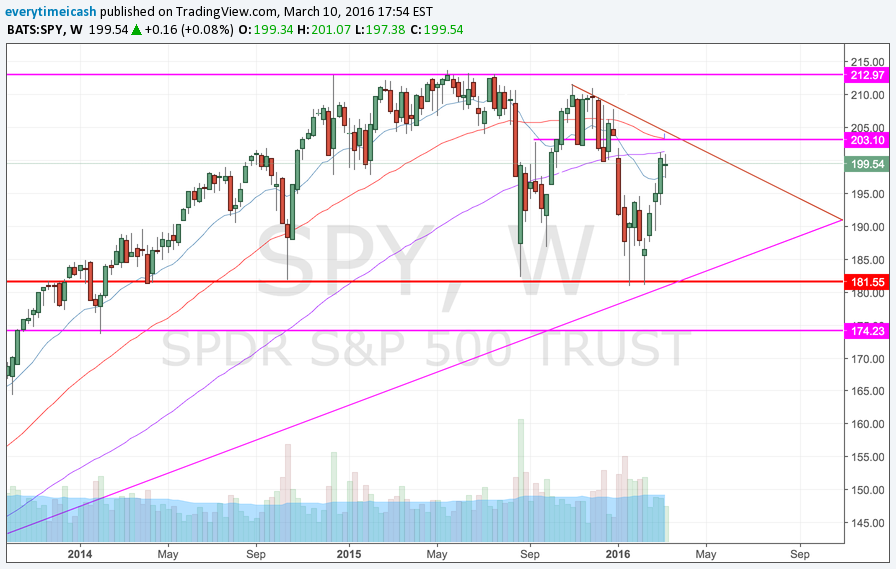
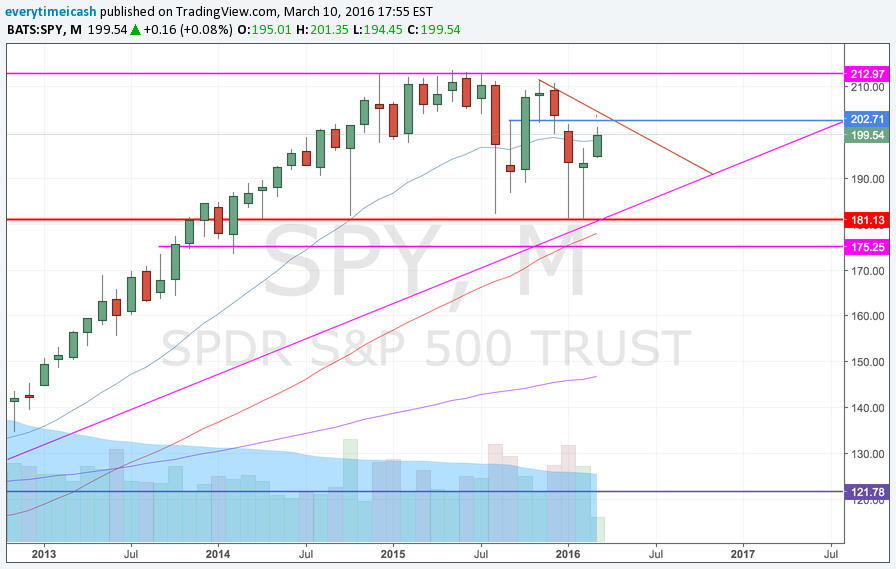
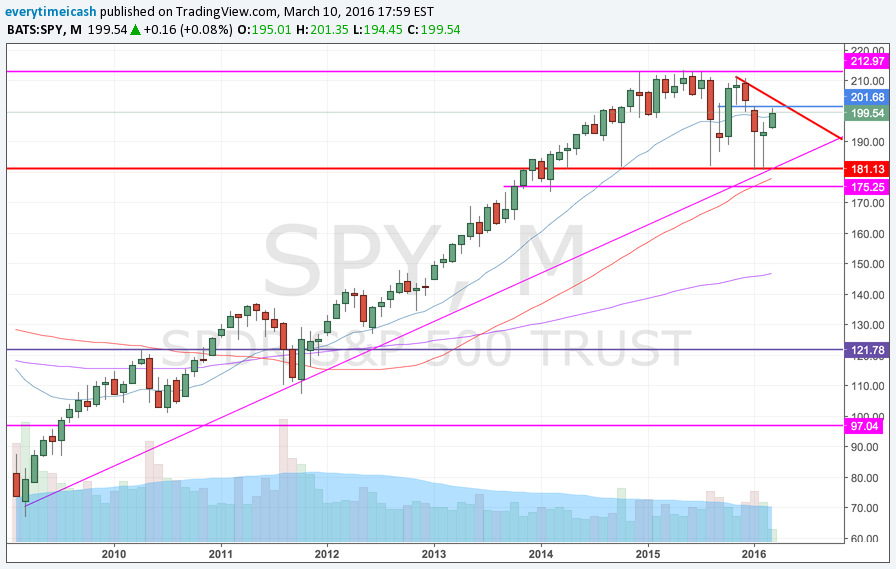
As we see above, the SPY longer term monthly trend remained in tact with its most recent test of 1800. This case emboldens the bulls to make the argument that we are still in trend and we have corrected. Furthermore if you look below, you'll see a chart of previous bull market bursts and their respective PE ratios at the peak. In this market we have been trading between 16-18x for quite some time now and the overwhelming euphoric conditions have simply not been there.
SPY PE Expansion in Bull Markets
Markets like this are designed for those who are "professional" in demeanor and nature. Point your attention to the figure below to understand how markets like these (when/if healthy) will and do work.
As you can see from the figure above markets suck in both buyers and sellers at max pain points
Though the above illustrates a bullish outcome, the reverse is also very true. In many cases issues resolve to the downside. When that happens, market declines typically precipitate and escalate more violently than the upswings. With the bull market top currently closer than the recent lows, it's difficult from a risk reward perspective to buy the top expecting higher. Thus is the bear case. In addition, economic outlooks don't give an optimistic view.
Again if you refer to the above charts, we have lots of overhead supply, MA's rolling over on larger time frames, and overall markets decelerating. Lack of breadth and leadership continues to be the theme and the previous outperformers are not participating.
“Successful trading is always an emotional battle for the speculator, not an intelligent battle.”
Alphabet, GOOG/GOOGL, just reported a beat in its most recent ER report and currently trades as the largest market cap company in the world today. This comes on the heels of a Facebook report that just crushed it, and an Amazon report that likely had Jeff Bezos silent for once. With that said, it's all systems go for the GOOG and it appears that their addition of Ruth Porat has changed the company's culture and impression on wall street to an "adult company."
Here are the #'s:
Alphabet beats by $0.58, beats on revs (752.00 +9.05)
Aggregate paid clicks- Q4 +31%; Q3 +22.8%:
Aggregate cost per click- Q4 -13%; Q3 -11%:
Revenue Segments:
This company just flexed its muscle and showed Wall Street (again) that it's not just some gimmick internet clicks company that can't turn profits. Furthermore, even at it's current valuation, the stock trades cheap ~20x forward and could create further room to the upside.
Investors continue to be rewarded for quality in the market even after wild swings that yield negative short term performance.
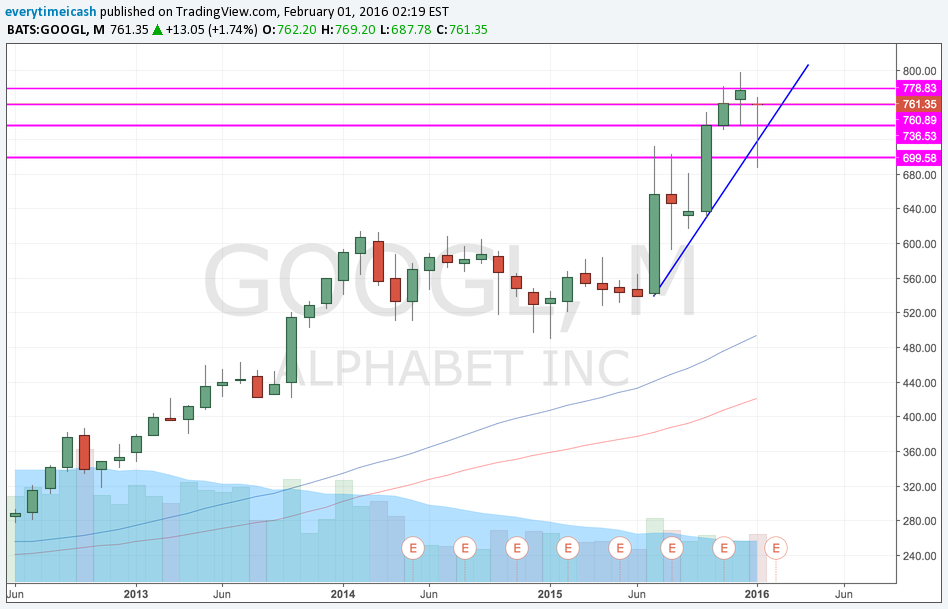
With its trend lines in tact, the measured move on this one suggest a 909 price target.
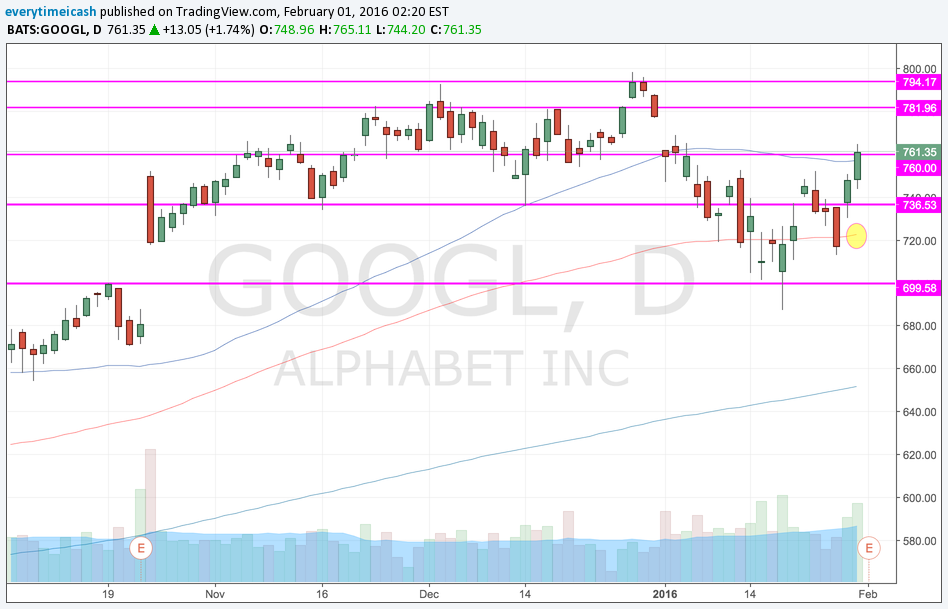

Even after a monster quarter by Facebook last week and the bar being set high, Alphabet was able to briskly hop over the expectations and deliver. An example of this is aggregate paid clicks which destroyed the streets estimates: (Aggregate paid clicks- Q4 +31%; Q3 +22.8%)
So what now for the stock? In the trade report put out yesterday we called for a +7% move in GOOG/GOOGL and a +$55 move in the issue. We were also long the weekly 760 C from last Wednesday and Next week 840/842.5 C.
I'd be a little surprised if this issue pressed like FB did. With market breadth nearing the top of a range and with this stock now the biggest market cap in the world, the law of large numbers does take effect at some point. On a longer time frame however I believe the trend is your friend and this company's new discipline and stellar performance should continue.
“Never permit speculative ventures to run into investments”
It goes without saying, even the least savvy market watcher can easily assert the correlation that oil and the markets as a whole have been trading in tandem. So when oil shot out of a cannon starting Thursday when it bottomed around 26.6 and moved all the way to 32/barrel it came as no surprise that it took the markets with it.
Whether it's up or down, it is human nature for market speculators to continue to try to find a bottom or a top in the current environment that were in. Speculation, in its most natural state, is done in such a way to avoid being the sucker. No one wants to be left holding the bag on the way up, and no one wants to miss the bounce on the way down. This peculiar, yet rather unfortunate state, is why we often see irrational buying when markets implode, and incessant top calling when markets sky. No man wants to be the "fool" in any/either circumstance.
Since the bounce in oil was all but telegraphed it puts the markets in an interesting position. It has been commonplace for oil and gas speculators to buy oil/gas when the weather gets cold and to cut it when weather gets warm again. So with the first blizzard of the year, and biggest one in years, combined with oversold conditions, risk in oil to the upside, and an overall market technical bounce, the bounce in oil futures was pretty much a "slam dunk."
Personally, I am of the mindset and the belief it is always best to avoid getting in the way of a train in motion (in this case oil moving lower). If you as a speculator believe that you can stomach whatever downside risk exists in oil, by all means have fun. From experience, I have learned that markets are significantly irrational and that they more than often overshoot beyond anyone's "rational" expectations.
With all that said, my bias on the overall markets currently is still bearish. That doesn't mean I am advocating blindly shorting, or suggesting that we are imminently going lower. I am simply looking at multiyear charts on multiple time frames in the SPY/SPX and CL_F and they still all look dismal.
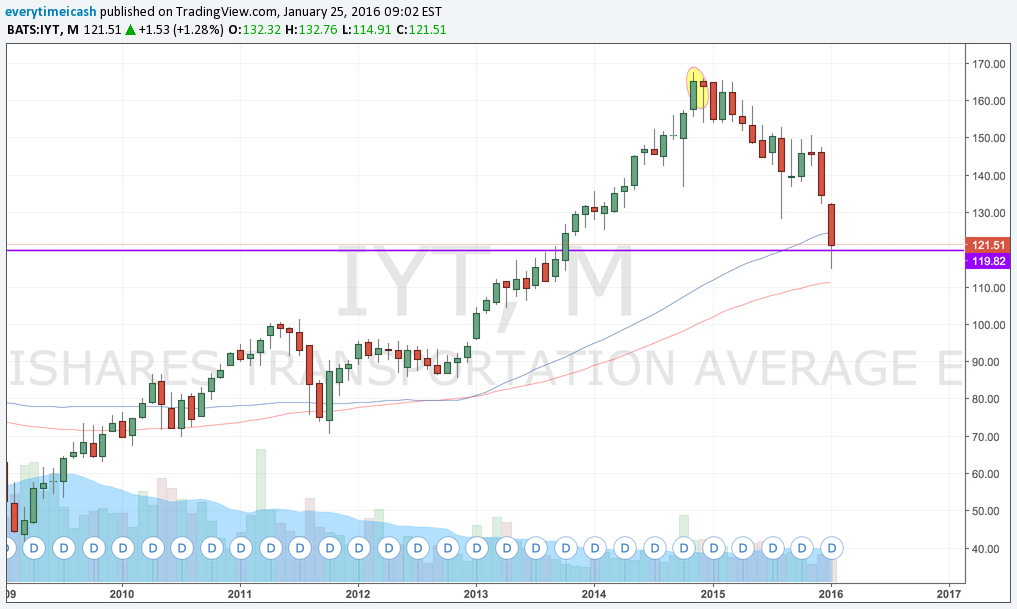
This move lower in the markets in general was telegraphed by the transports in November of 2014 when the IYT topped out and began its imminent decline. (Not) Coincidentally, the WTI broke multiyear support that same month and has never looked back.
If we expand the charts to the start of the bull run in 2009 we notice that both these issues had stellar performances starting in 2009. The IYT advancing almost 400% (rough estimate) and WTI advancing nearly 335% (rough estimate again). The parallels here are fascinating with the most interesting caveat being that even with their sharp declines there is still room to run. Only recently did oil break its 2009 base bottom and the downtrend in the oil markets only calls for further downtrend in the IYT as shipping costs via trucking decrease in price with the falling price of gas.
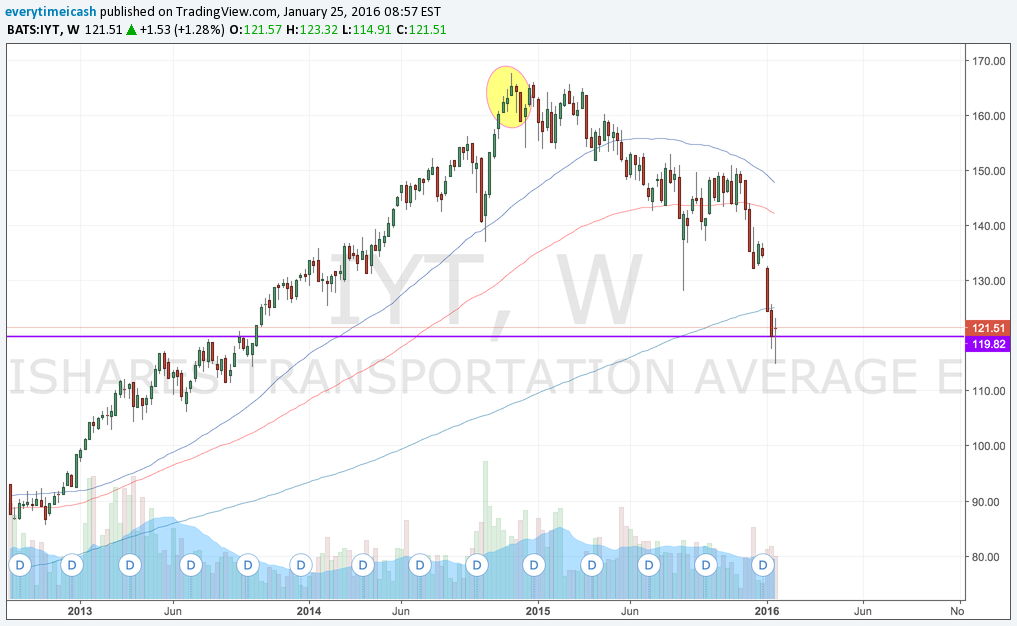

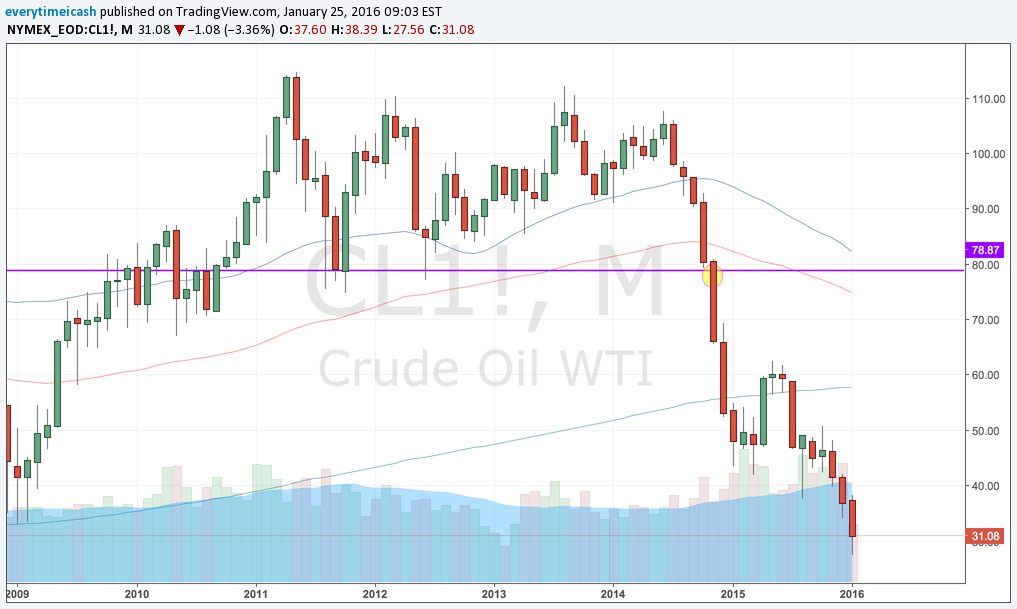
The main point I am making here is that trends don't happen overnight. Just like the IYT and WTI broke almost 1.5 years ago and we're only now reeling from their problems, a two day rally that was telegraphed doesn't reverse course. It is important to take things as they are, and to remain steadfast with the overall (larger) picture. My bias will remain negative on both oil and the markets so long as the larger picture for both these issues remains to the downside.
“Don’t trust your own opinion and always back your judgment until the action of the market confirms your theory.”
AS I write this U.S. index futures are getting obliterated. This comes in tandem of China's weaker yuan that has since created a rout in their equities just days before their Chinese New Year. This tumble has triggered their circuit breakers for the second time this week.
The ES_F index is down a little over 1% to 1961 on the lows. That's nothing in comparison to what's happening in China though where the Chinese stock exchanges shut down shop less than a half hour after they opened after the CSI 300 Index obliterated more 7% triggering another circuit breaker event.
The catalyst for the selloff in Asia comes after China's central bank cut its daily reference rate more than any other time since August. China's signaling to the rest of the world that they've got an increased threshold to do what it takes to shore up their weakening economic growth.
China puts everyone else on edge Jenga style.
We've seen an accelerated retreat from risky assets to start the new year. With the riskiest equities taking it on the chin first. The index as a whole has already seen a 2.4% haircut and will presumably end the day and week lower than that.
This is a classic real life scenario of the popular game Jenga. With different blocks coming off the whole group one by one. Unlike Jenga however, we don't actually need to see these blocks come down. Financial markets are operating in fear that the yuan's sharp depreciation may only accelerate, which would signal that China's economy is even weaker than everyone believed. If that's the case we could see a spark of another wave of devaluations around all of Asia and in other key countries/economies.
With Wall Street closing at three month lows on steady volume, the signal is clear. Risk aversion is on the board. Asset managers are getting out of the riskiest assets and avoiding another shoe dropping on them. This risk aversion was only amplified by the overnight plummeting price of oil and the geopolitical concerns behind North Korea's nuclear test on Wednesday evening. And now we get this shit. Fuckin' China.
Let's take a look at some levels.
SPX has been in a downtrend on the daily. 1973ish and 1954ish are the next lines int he sand.
Above you we see the S&P 500 levels and downtrend on a daily basis. Below we'll see it on a weekly basis.
SPX weekly
With all the turmoil and an absence of buyers in the market the bias remains to the downside. And with uncertainty as to how levered banks are and the level of exposure they may be facing when oil companies start going down this makes for a very troubled market situation. As I stated in the first post of the new year, the catastrophes that may lay buried underneath the oil madness are uncertain as of now and we should not try to pick bottoms. With a hint today that levels of credit default swaps in oil backed securities possibly being so high in some companies that bankruptcies and failures are nearly imminent, it goes without saying, get the fuck out the way.
It is quite obvious beyond that rhetoric that in some cases a chase for performance and growth may continue so it is my bias that we continue to trade opportunities to the long side as they present themselves while maintaining a downward bias.
“It is not good to be too curious about all the reasons behind price movements. ”
Like many, I spent a part of my weekend keeping tabs on what was going on in Paris. I tried my best to avoid 3rd part media outlets and tried to stick to raw data from a Reddit thread a friend of mine passed on to me. Going into Friday my bias was to the downside and with relentless selling pressure and support broken on Friday in SPX I saw no reason for that downside pressure to cease.
So with the news of a terror attack shortly after the market closed on Friday it was no surprise that stock futures accelerated their declines. And when they closed for the remainder of the weekend at 8pm on Friday, the markets were hinged on just how bad the news would be from Paris. Two days of pins and needles. When they finally reopened Sunday night those wanted to panic did. And with that sudden and slight panic we tested the 2000 support level on SPX and found support there. Monday's session followed this lead and the markets continued in uptrend fashion "business as usual."
Personally, I am not a fan of trying to find trades that require precise entries. I prefer broader time frame breakouts/breakdowns and find painting with a broader brush to provide the optimal risk reward for success. Monday's tape however provided great opportunity for "bottom fishing." Specifically with AMZN.
AMZN's stock just came off nearly a 10% decline from its all time high just this past Thursday. The issue was trading off nearly 53 points in just 1.5 sessions. This decline landed the stock near some critical support and gave us an entry opportunity. Again, I am typically the type of trader that finds broad based breakouts and breakdowns on multiple time frames, but could not resist an opportunity like this. I want to quickly assess the psychology of the trade and give a frame of reference to it for future potential finds like it.
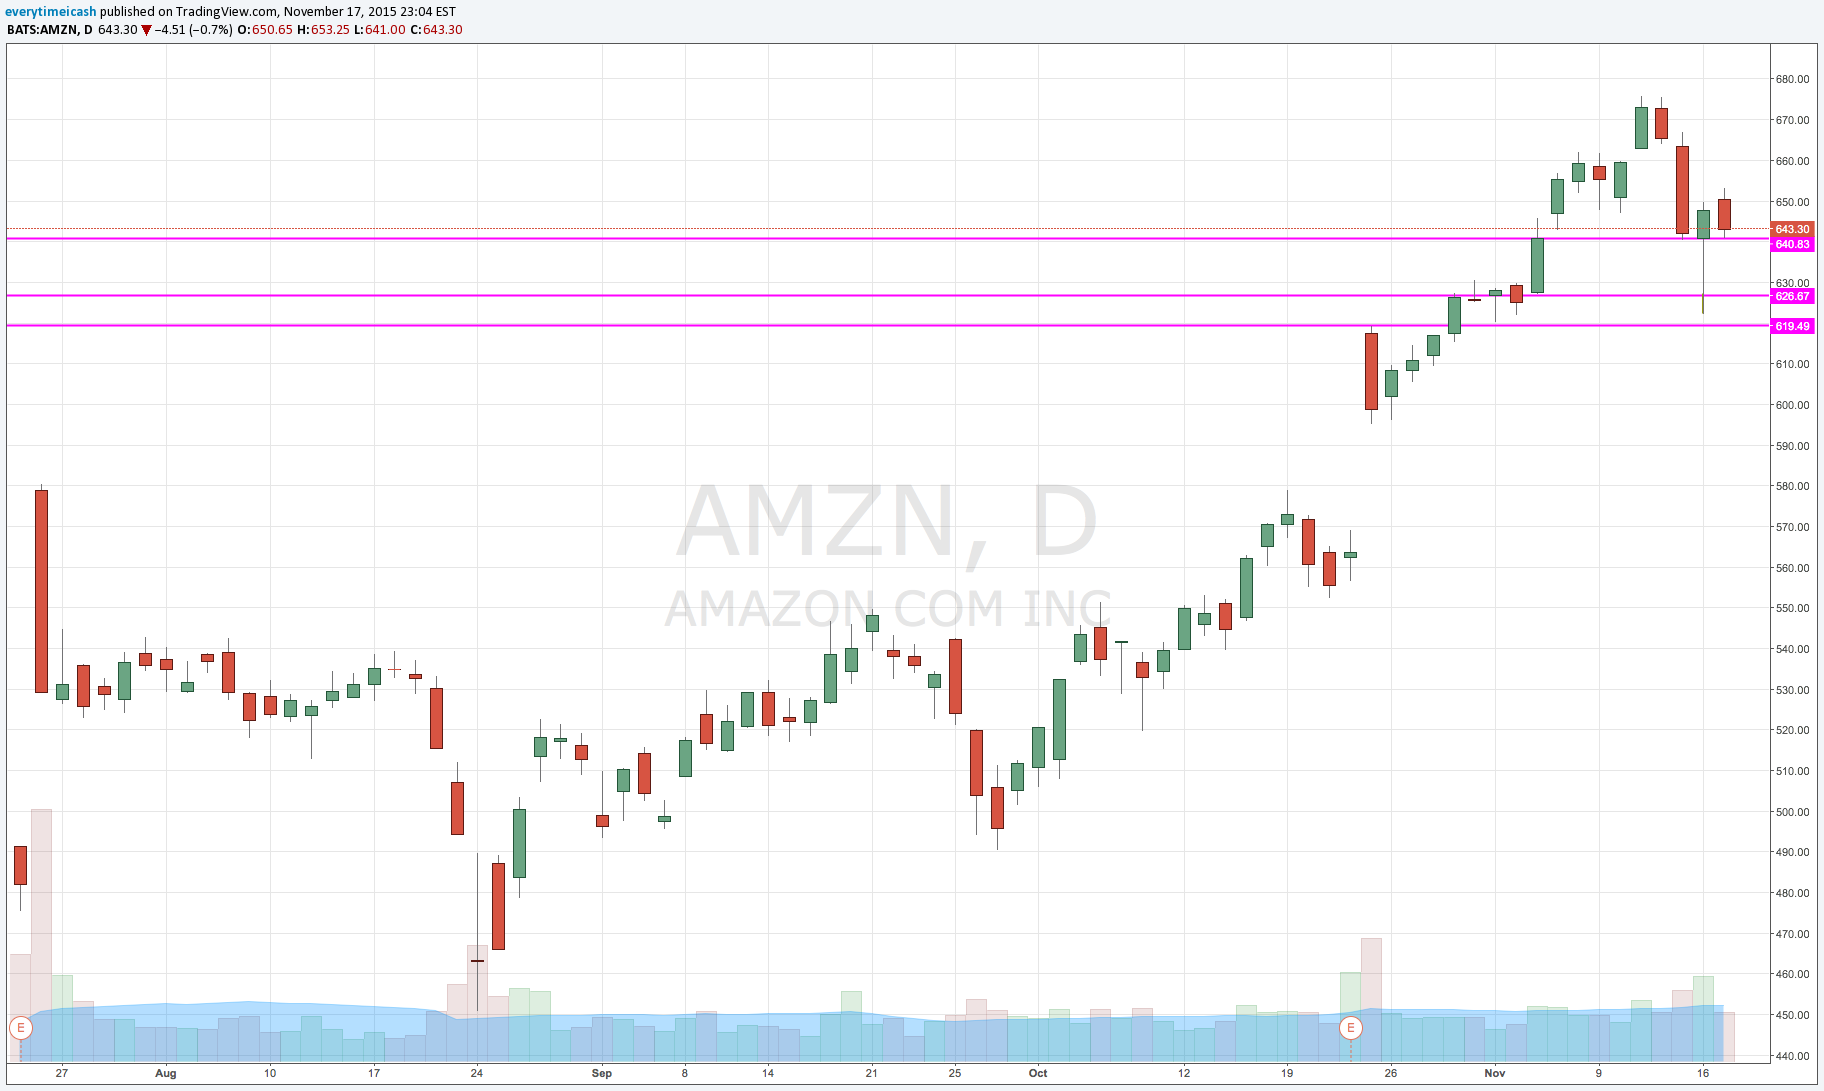
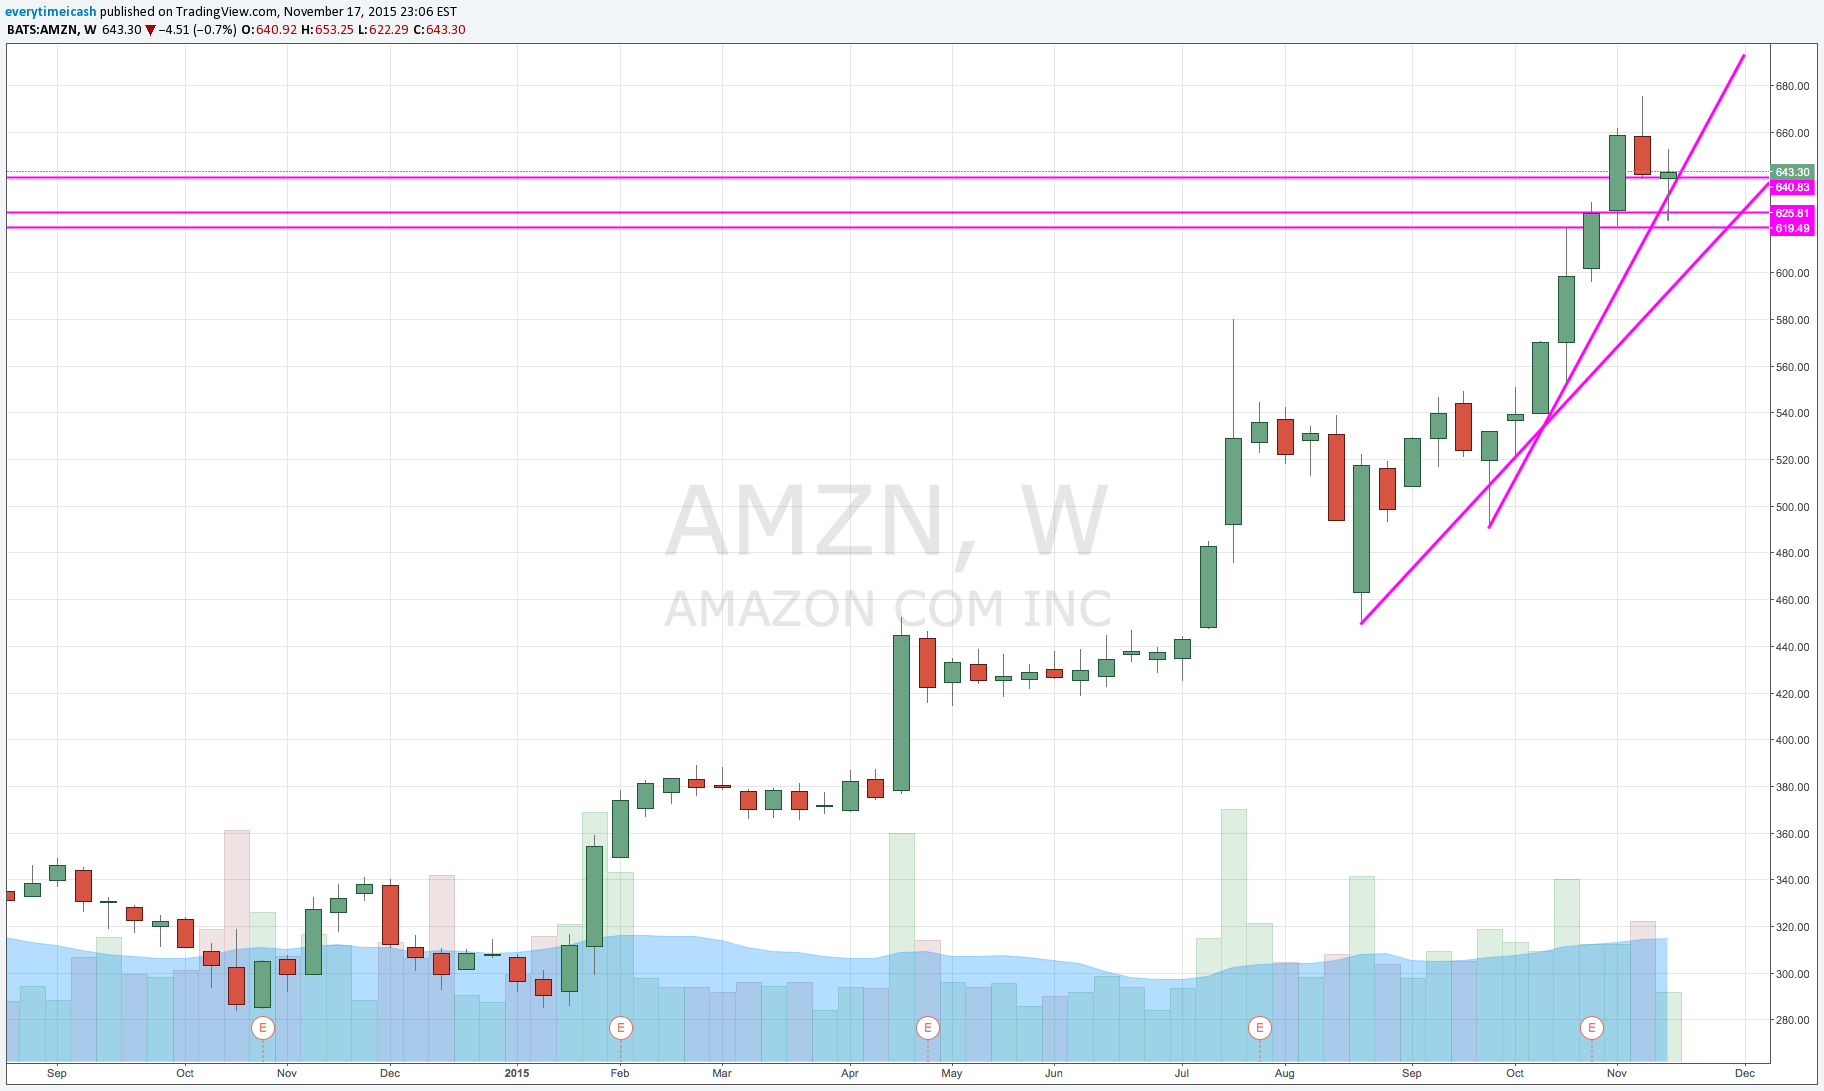
If we take a look at both the daily and weekly charts for AMZN we notice that there is support near the 620 level on the issue. Furthermore, if we take a look at the 4 hour chart we see a solid trend line in tact and both support and 50 day support lined up again near 620. With this information, I assessed how the stock would behave on a five minute basis (MOMO) intraday chart.
As we can clearly see on the five minute chart, the issue found its support around 620 as we'd hoped. Specifically we saw three hammers on the five minute followed by higher lows and higher highs. Though our exact target of 620 was not necessarily tagged, that level was in fact tested and did in fact hold. That presented us with a beautiful combination of an opportunity.
The following combination is what I'd like to highlight:
-Approximate 10% retrace from ATH in just two sessions
-Wildly "oversold" conditions both in the market itself and in the issue
-Multiple time frame support alignment
-Multiple hammers against multiple support levels.
With that said, each one of these indicators alone would present for a good opportunity to the long side. Combined they presented a great combination for a very well defined trade. Moving forward, we are now able to see what sort of potential a trade like this may have.
“We want to perceive ourselves as winners, but successful traders are always focusing on their losses.”
I want to start by saying that even with today's nonsense I walked away from the table with a significantly profitable day. Not Wall Street billionaire or Oprah Winfrey Weight Watchers big, but big nonetheless.
I have been a trader in some capacity, whether amateur or professional, for over nine years now. In my time I've survived some crazy upswings and some violent turmoil. I've seen companies implode and others sustain astronomical gains. I've watched as CNBC has recycled and churned their fair share of pundits and "hot shots." Like all "viewers" I have my fair share of likes and dislikes, I've ridden the wave of "Fuck you Uncle Carl" to "Holy shit, uncle Carl!", and have watched the totem pole of the "Hot new hedge fund king" get churned.
With all that said, I've never seen anyone cross the airwaves (including Dan Nathan himself) in such privileged pejorative guile anywhere close to that of William "Bill" Ackman. Aside from his self absorbed attitude where even his billionaire peers hate his guts, I cannot recollect an instance in the last three years plus where that guy has been significantly right on anything. When I pour through his bio, I can't see anything really that screams "Brilliant" when it comes to trading or investing. I guess the MBIA thing maybe, yeah, maybe? 10% stake in Target? Well I guess if you have that kind of cash, yeah sure. The Barnes & Noble deal? Lol, really? That's all you got?
Before I go any further I want to take a moment and show a two graphs. I also want to remind everyone that no one individual is bigger than the tape. No matter what sort of self righteous Napoleon complex exists with them, they are just minnow in an ocean of whales.
Bubble Phases
These are the well known, repeated, and outlined phases of any stock market bubble and crash.
VRX Weekly
If you lay VRX over the phases of a bubble what do you get?
Fucking perfection.
Dear Bill, you privileged narcissistic asshole, you are fucking wrong. Admit it, move on.
The fun thing about the market is that even when you are right, but not right with the timing, you will go broke before you are actually right. I get it, you grew up in a privileged New York Real Estate family and are accustomed to hanging around people that were not on your level. But Billy, this is like the time where you bet your dad you'll get an 800 on your SAT. Except this time, your dad can't let you off the hook and you're fucking with other people's money. Not just your own. This isn't
Oh and Billy, take it from a guy who actually got a perfect test score and is used to being "The smartest guy in the room" (even with you in it). Doubling down on monopoly money at the tail end of a QE cycle is just lunacy. Especially when shit is broken. You might as well head to vegas "Playar."
Based on nothing more than your arrogance I hope to God you're wrong and this VRX is Enron 2.0. Just so I can stop hearing about you and your self adoration.
Aside from all this, I am just unsure how long this will last before people start to investigate if you're running a Ponzi Scheme the likes of which has not been seen since Bernie. Seriously, how is anyone as wrong as often as you are without any severe setbacks? Tick tock Billy, tick tock.
“Markets can remain irrational longer than you can remain solvent.”
I'd like for you to read the quote at the top of the page and let it soak in. Take a few moments and read it over and over and out loud if you have to so that you can become a believer in that statement. There is no greater cause for money lost than conviction in the wrong direction. This post goes hand in hand with the first post of this thread "Stick to the Plan."
The purpose of this post is to reassure you that neither I, nor you, nor your mom, nor your best friend, nor Goldman Sachs, nor the Market Maker, nor Warren Fucking Buffett know where the market will ultimately go. We have our charts, our technical analysis, our valuations, and we play the odds but ultimately that is all we are doing -- playing odds in our favor.
The stock market's prices are strictly an indication of future value based on speculation. As such, the "game" of speculation is determined based on future favor. Simply put, an equity's price is basically what people are willing to pay for it now based on where think the company's value will go later. That said, how is a stock's price often determined? Let's address this below.
People often mistake a company's market cap as the value of the company. That is not only wrong, but it will certainly mislead you into believing a company is good/bad depending on its size. A company's market cap is simply the total dollar value of a company's outstanding number of shares. In layman terms, market cap is the total number of shares a company has x the stock price.
Market Cap Example: Company A has 500 shares available for sale at $2.00/share. Company A's Market Cap is $1000.00.
The point of this is to remind you that when you're wrong (you being everyone, myself included) you need to admit defeat quickly and get out of your false assessment. Markets move irrationally, and when that irrational behavior takes over against you, it will cost you more than you'd typically imagine. I will highlight this irrational behavior below with several examples, some present and some from previous days. To start, I will highlight the craziest one of them all -- the Tulips.
For those of you who don't know, Tulip Mania or Tulipomania was a period during the Dutch Golden Age where in 1593 tulips (yes the flower) was brought over to Holland from Turkey. They started off as a novelty and the flower quickly became sought after and ultimately pricey. Fast forward a bit and the flowers contracted a virus called mosaic that didn't kill the flower, but instead changed them causing "flames" of color to appear on the flower petals. This made the flowers more "rare" and "unique" flowers. This ultimately drove the price of the flowers through the roof. The flowers were subsequently priced based on how their virus alterations were valued, or desired. Seriously, people were putting different prices on the same flower because they thought one was more valuable than the other. Soon after, everyone began "dealing in bulbs" and boom a speculative tulip market was created and believed to have no limits.
Bulb buyers (the garden centers of the past) soon started to fill up inventories for the growing season. This only limited the supply further and increased the demand and "scarcity" of the tulip.
Prices started rising so fast and high that people were selling and trading their land, life savings, and their loved ones (joking here... I think) so they can get their hands on more tulips.
Now if you think I sound like I'm crazy you're right. I sound like I'm fucking nuts. But sadly I'm not, and I'm not making it up either. That really happened. So how high do you think the cost of a tulip bulb went in the 1600's?
$20?
$30?
$50?
I wish it stopped there.
Prices moved nearly 20-fold in a month in an already insanely overpriced market. At it's manic peak, an average bulb could be sold for 160-200 Guilders.
Tulip prices From November 12 1636-May 1 1637.
The point I'd like for you to take away from this is that markets set themselves. Let your positions run as long as you can afford to, respect your stops, and never think you won't have another opportunity like this again. It takes two sides to make a market and in doing so the market is always binary and always wins. Secondarily, whether it’s tulip bulbs, houses, .com stocks, crypto assets, or any other future novelty that will come; this shit is nothing new. It is all the same. The intrinsic value of whatever asset you hold is determined based on the scarcity of the supply and the perceived value at any given time. With any asset or store of monetary value there is always an inflection point where the risk paradigm skews in favor of releasing the “asset” and returning to “cash.” Cash here is in quotation marks to account for the different permutations of “cash” that have existed and will exist throughout time.