Viewing entries tagged
GDX

Golden Miner $NEM Earnings

Golden Miner $NEM Earnings

Newmont Mining beats by $0.15, beats on revs; provides 2016 production outlook 

  • Reports Q1 (Mar) earnings of $0.34 per share, excluding non-recurring items, $0.15 better than the Capital IQ Consensus of $0.19; revenues rose 3.0% year/year to $2.03 bln vs the $1.87 bln Capital IQ Consensus.

  • Attributable production totaled 1.23 million ounces, compared to 1.19 million ounces in the first quarter of 2015. During the quarter, higher production at Batu Hijau and Kalgoorlie and inclusion of CC&V more than offset declining production at Yanacocha and the sale of Waihi. Attributable copper production totaled 38,000 tonnes compared to 37,000 tonnes in the year ago period as Batu Hijau continued to mine higher grade ore.

  • Capital expenditures for the first quarter were $297 million, including $111 million of sustaining capital.

2016 Outlook:

  • Attributable gold production is expected to increase from between 4.8 and 5.3 million ounces in 2016 to between 5.2 and 5.7 million ounces in 2017, and remain stable at between 4.5 and 5.0 million ounces through 2020.

  • Attributable copper production is expected to be between 120,000 and 160,000 tonnes in 2016 and 2017 before decreasing to between 70,000 and 110,000 tonnes by 2018. The decline is due to the depletion of higher grade Phase 6 ore at Batu Hijau in 2018. Production at Phoenix Copper Leach and Boddington is expected to remain stable for the period.

  • 2016 sustaining capital is expected to be between $700 and $750 million increasing to between $800 and $900 million in 2017 to cover equipment rebuilds, water treatment and tailings storage facilities.


Gold in Black

Gold in Black

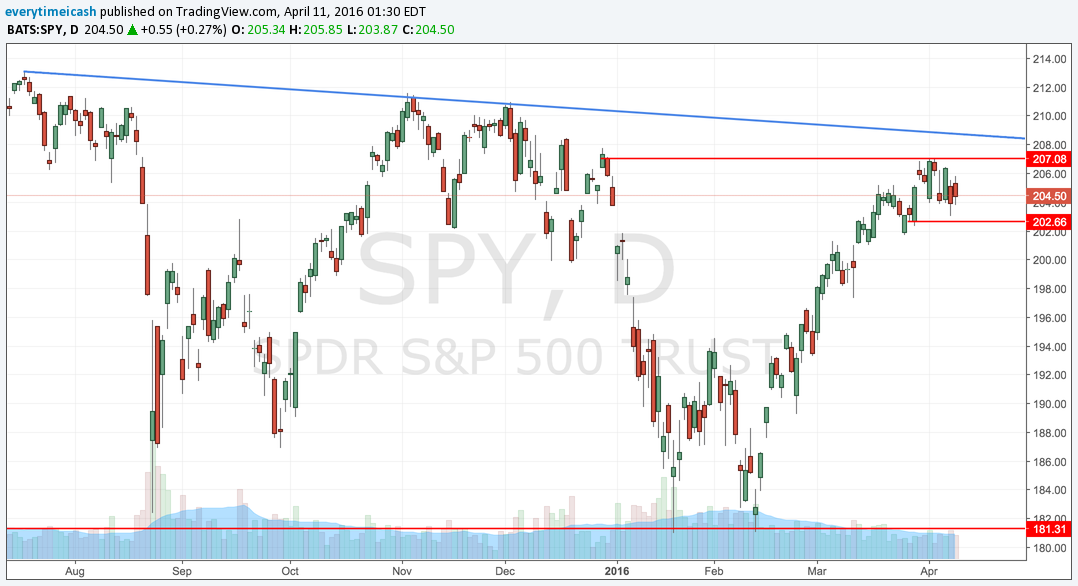
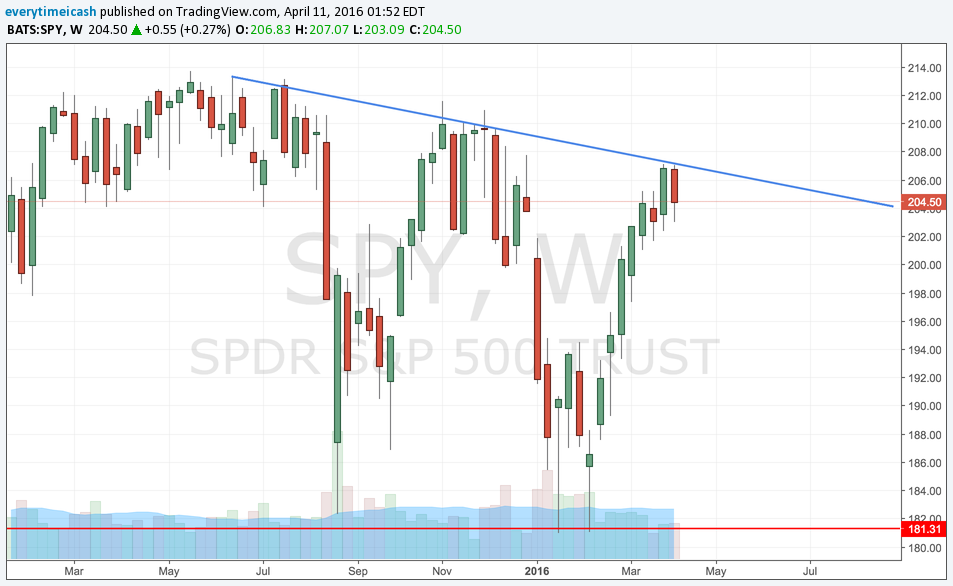
As expected, last week showed us a range bound week (inside week) following a 12% run up in the SPY. Action was quite volatile relative to the last few weeks with a couple of false breakouts and breakdowns. 

SPY

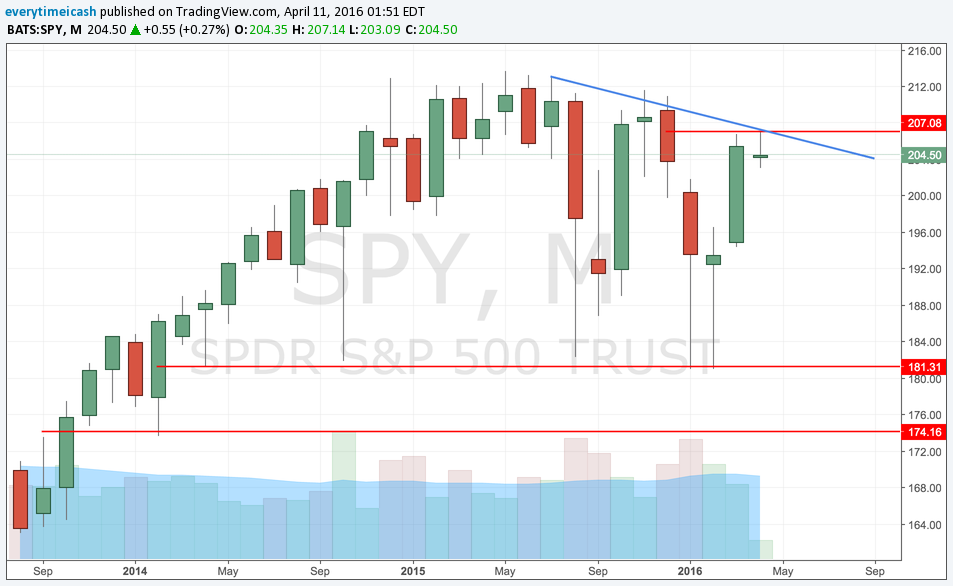
The SPY was range bound last week with 20 and 200MA functioning as support. As highlighted last week the 2030 level has functioned as support for the SPX and 2070 has been resistance. After last week's inside week we're going to pause for a break to the upside above 2070 or a breakdown below 2025. My bias is that a new wave of leadership is forming in the markets and that this rally in gold can propel for a while longer. That said, the SPX/SPY is in a downtrend since May of 2015 with lower highs. We will in fact see as earnings season kicks into high gear and the banks start to report.

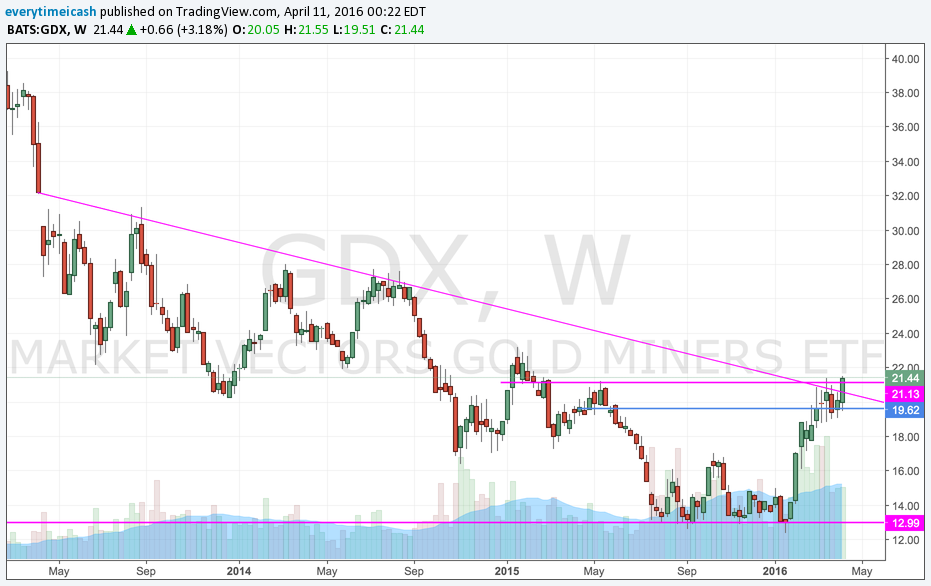
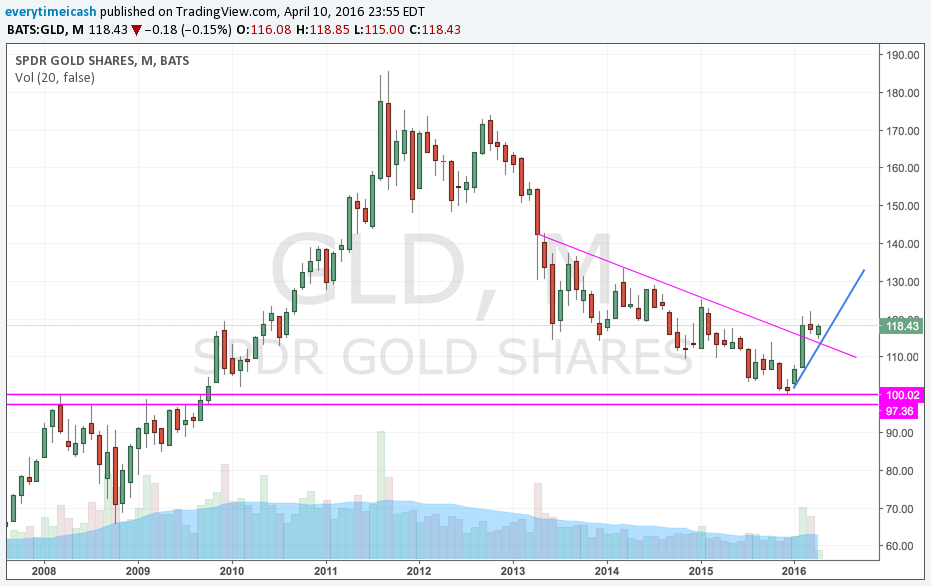
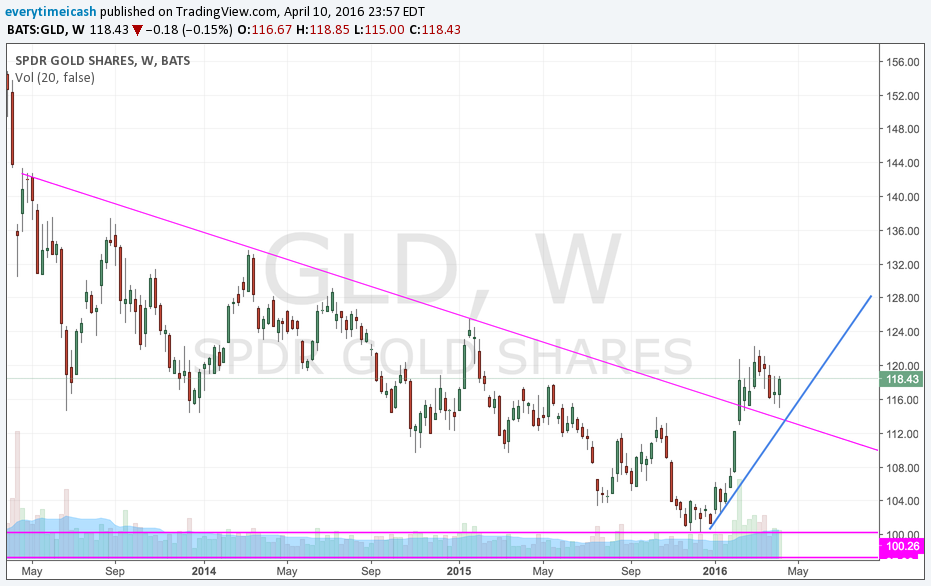
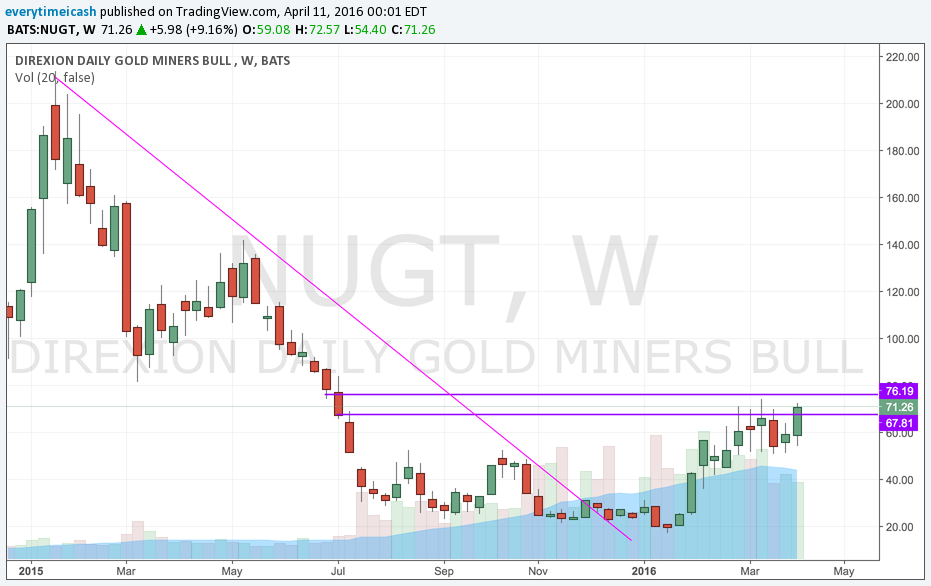
GLD GDX NUGT

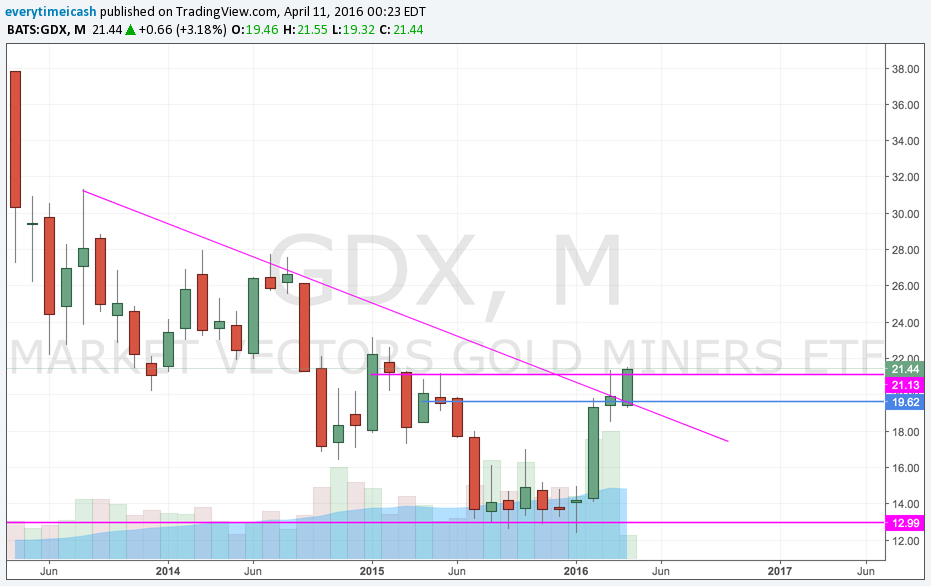
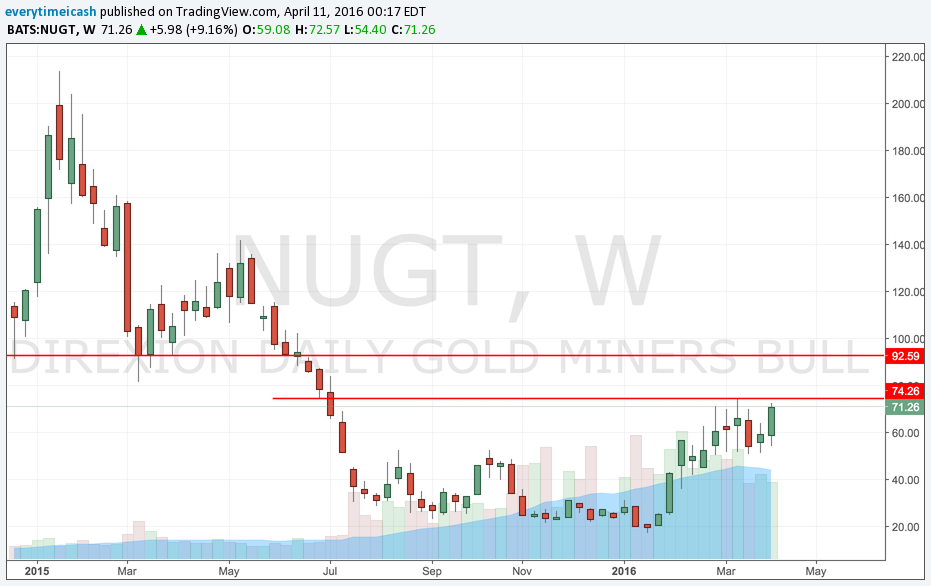
As seen recently, gold has begun to break out as it broke its downtrend with a higher high and channel break. After a period of consolidation, it is apparent gold is ready to make its run again. As gold goes, so do its derivatives

IBB

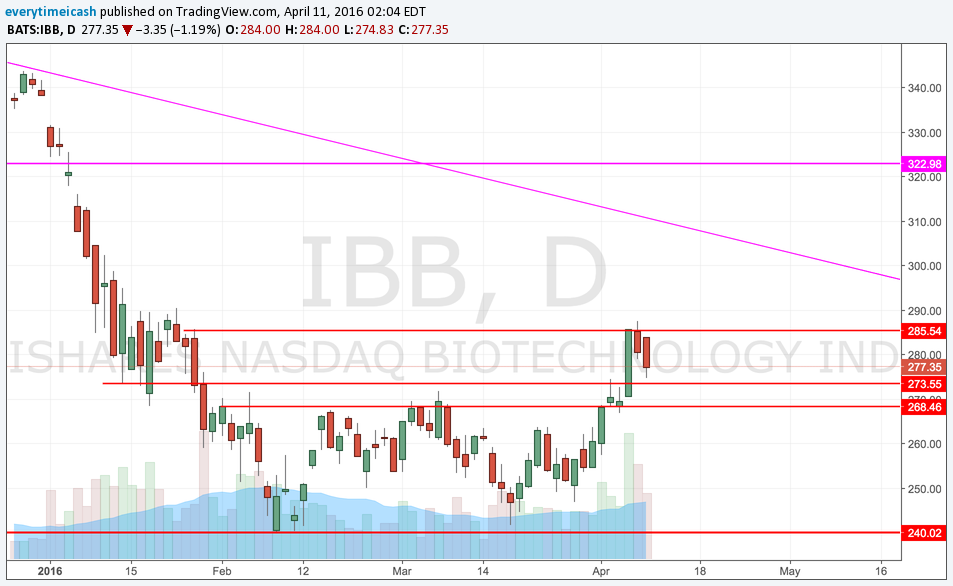
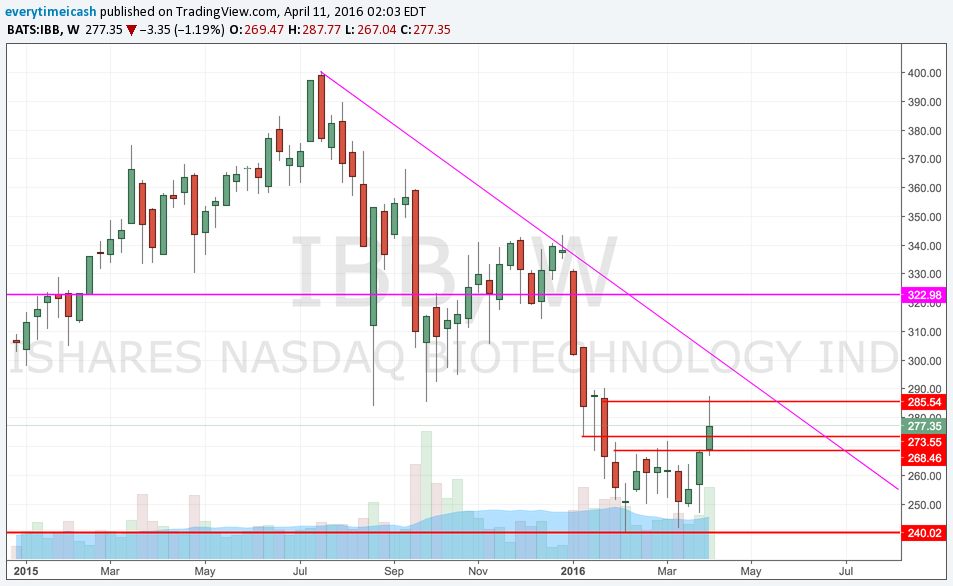
As noted two weeks ago, the IBB bounced of its 50% retrace from the highs and has continued the run since. Our target of 285 was reached and we're now waiting for some consolidation before a potential run higher. A potential retrace to the downtrend is what we're potentially looking for.

LUV

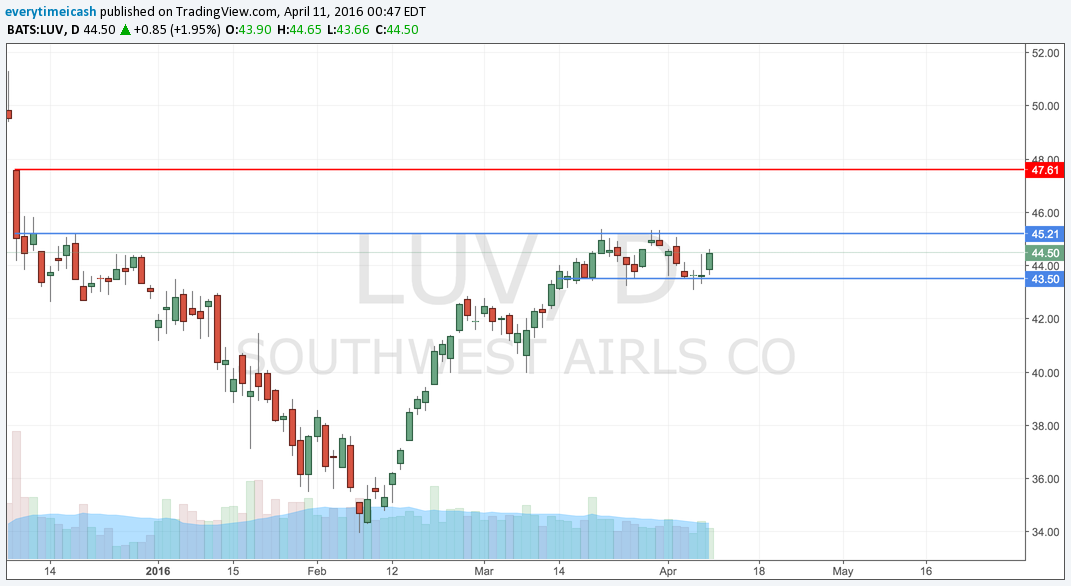
Aggressive call buying into consolidation and this one is set to take off higher. 

TSLA

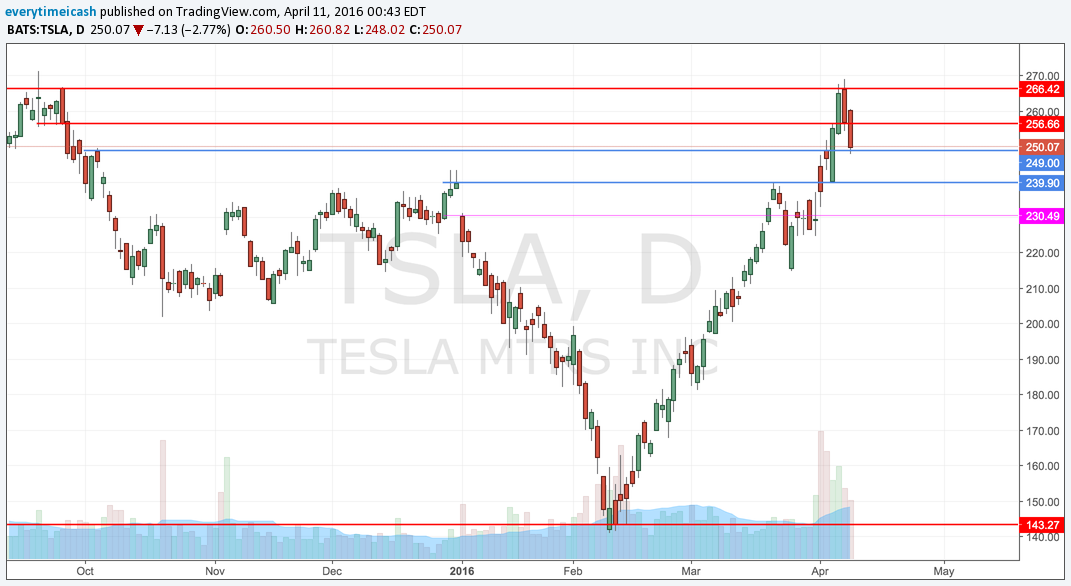
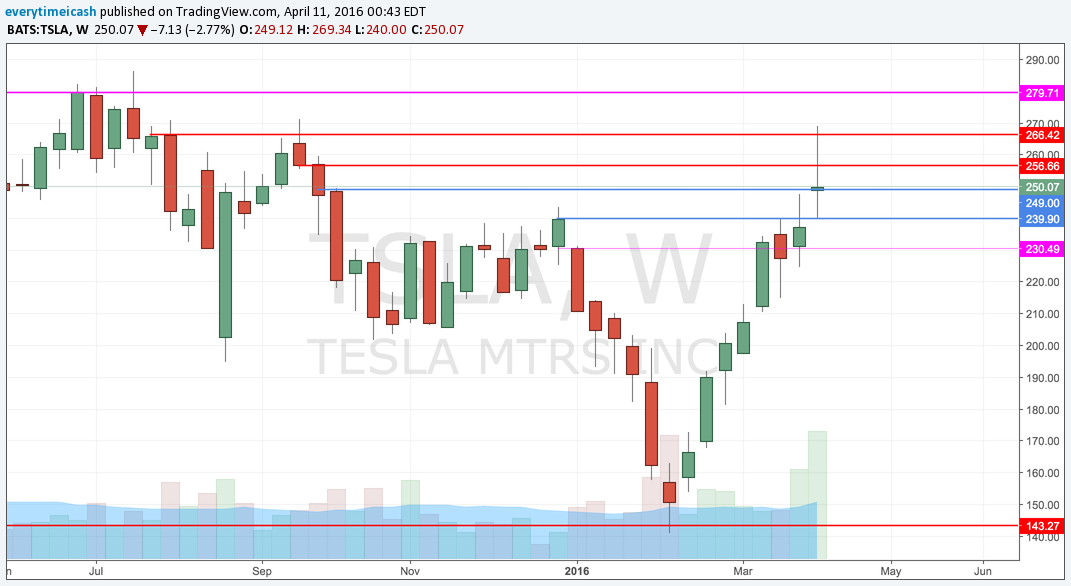
After a torrid run up almost doubling its share price in approximately six weeks, TSLA finally hit resistance and started to turn lower. 

AMZN

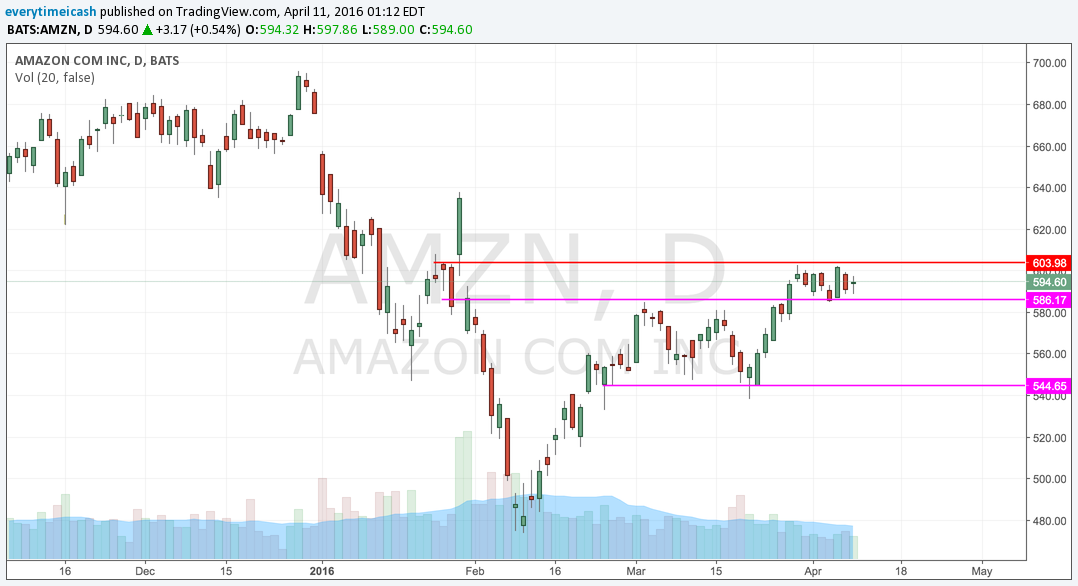
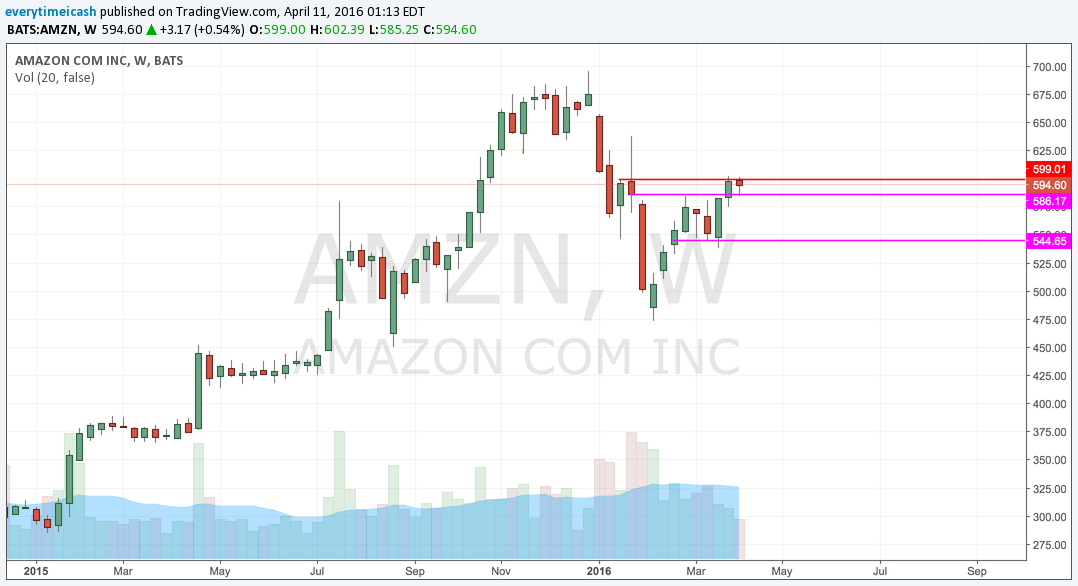
After a face rip week, last week saw some consolidation. We're working with a flat 200MA and a breakout above 604 to spark this thing.

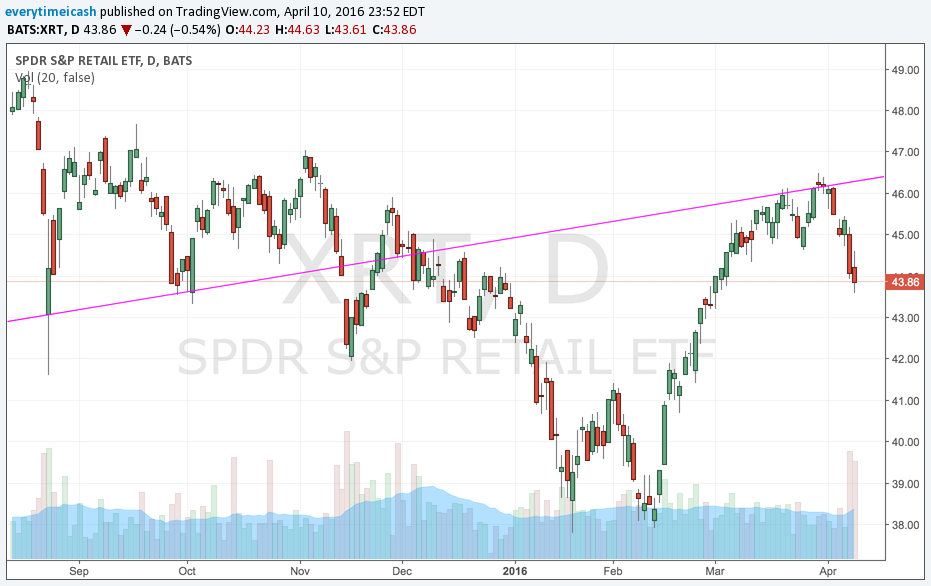
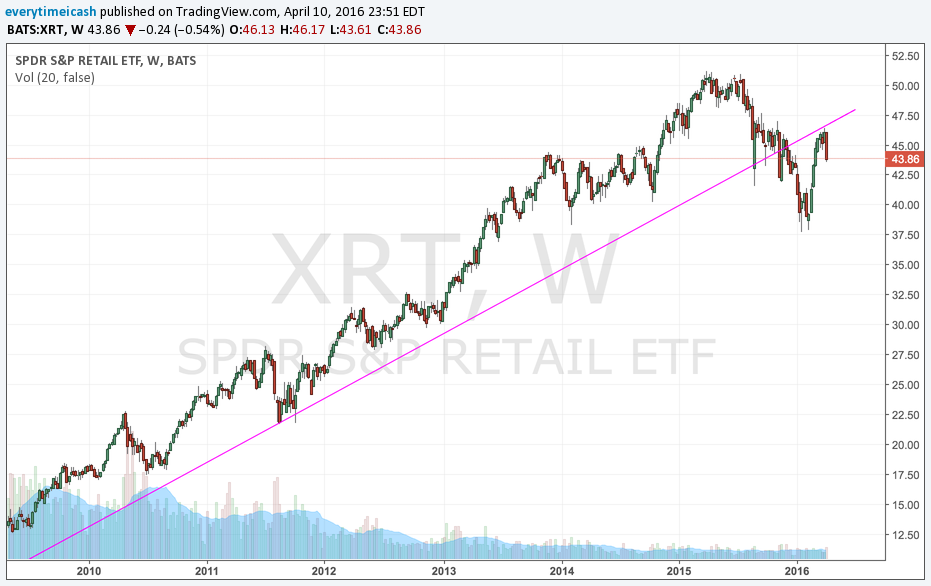
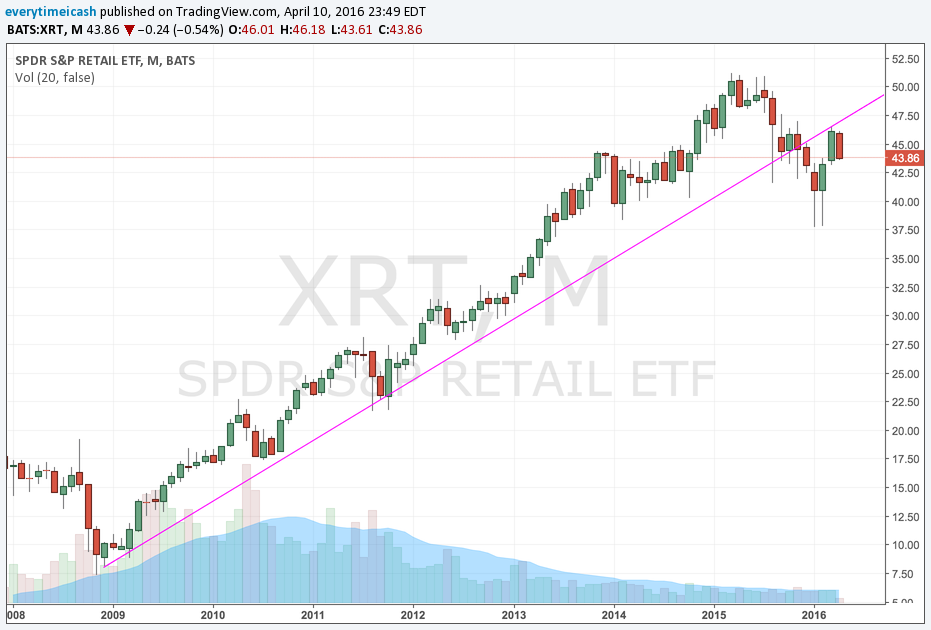
XRT

After leading us on the way up, XRT has started to roll over as it hit resistance into its previous up trend. 

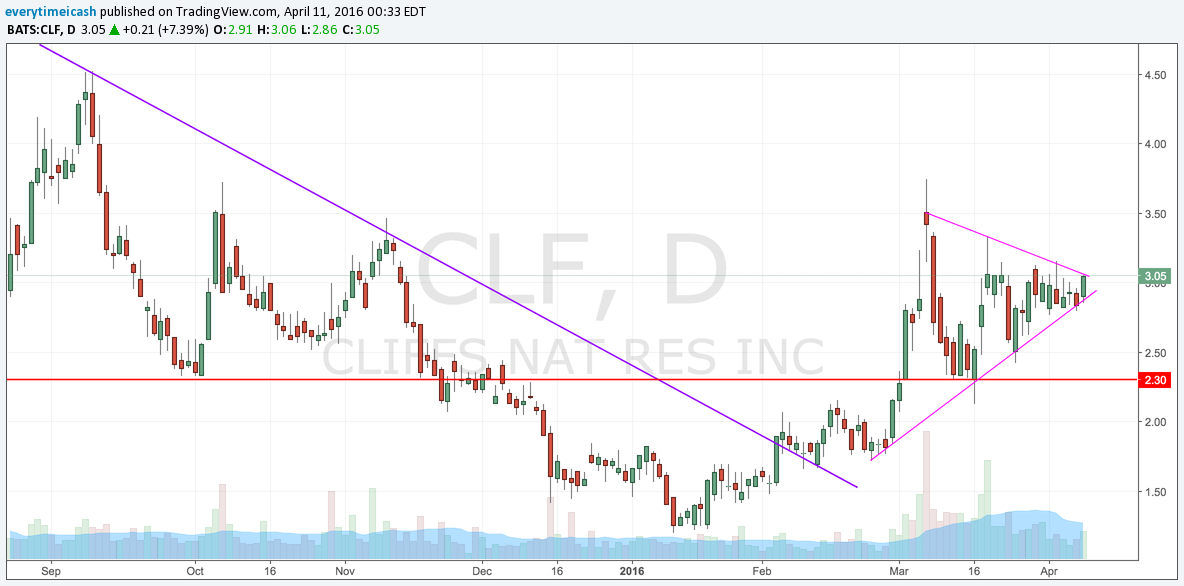
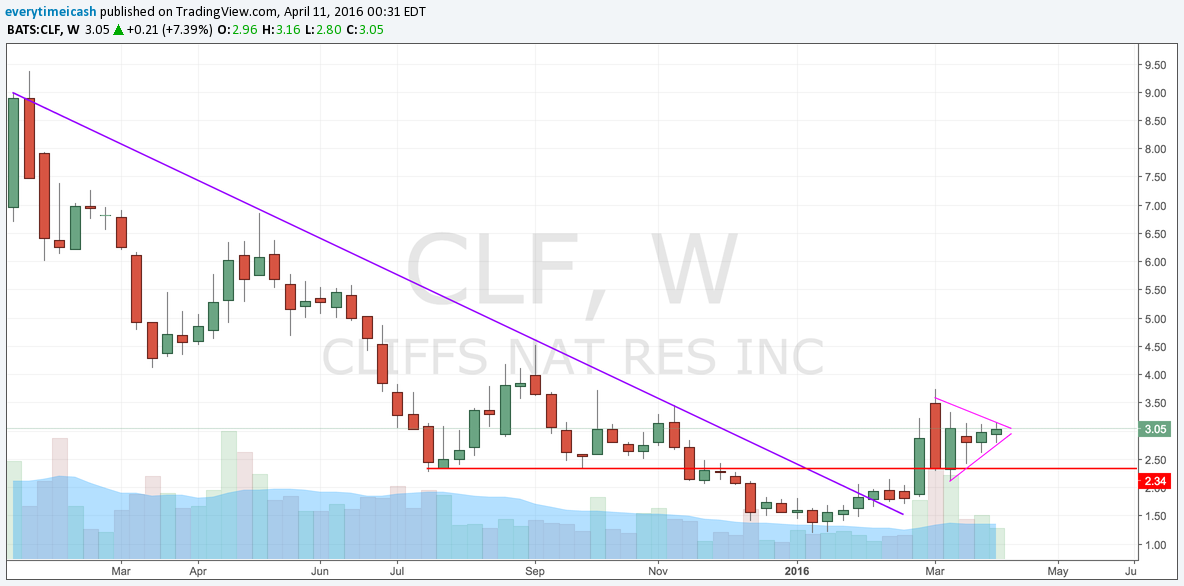
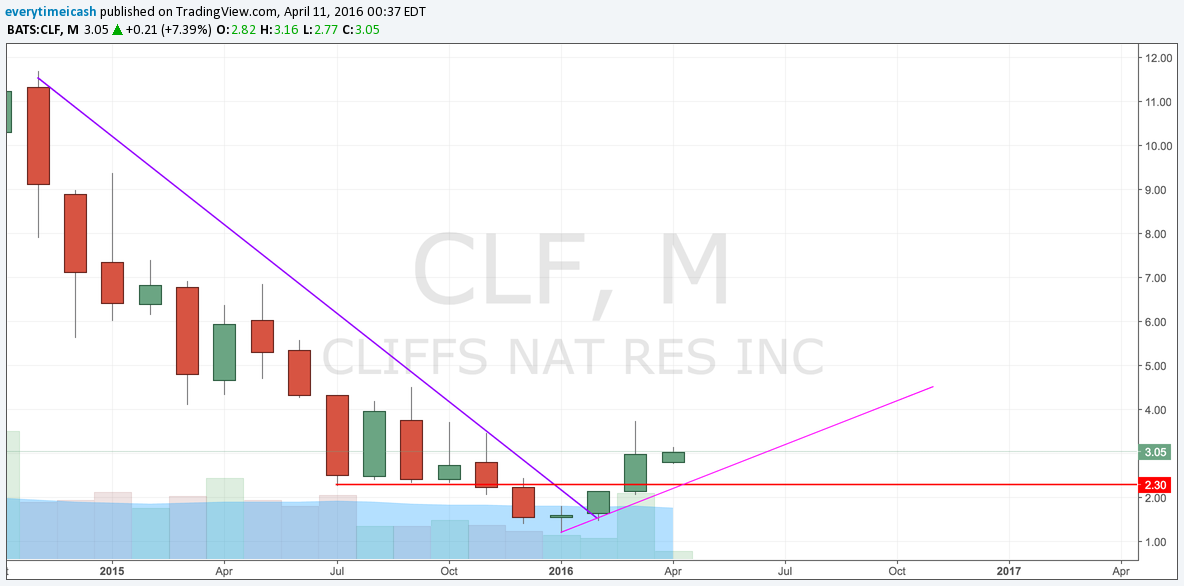
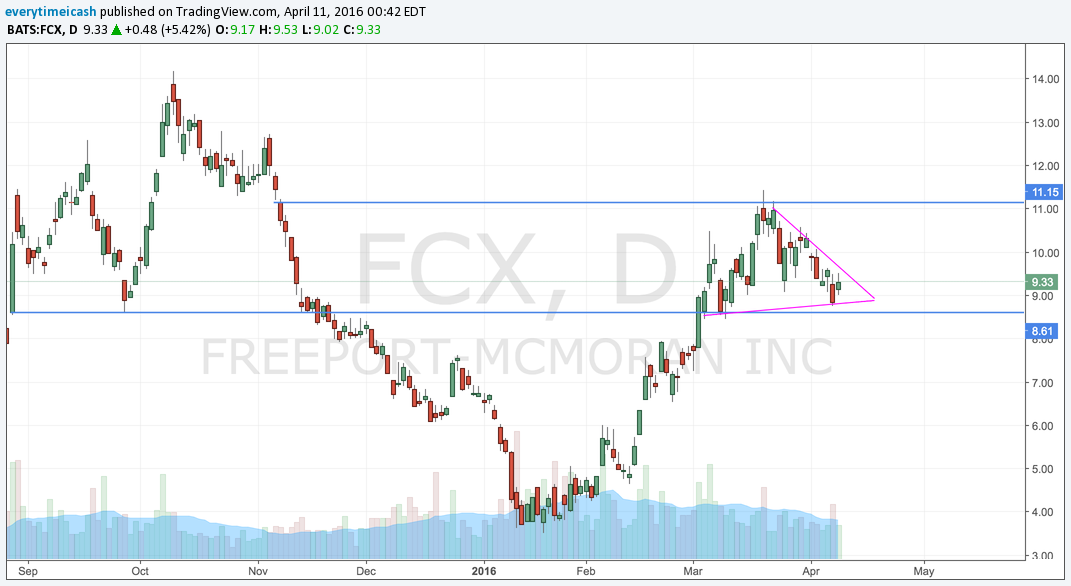
CLF FCX

Both in a flag and looking to break up or down. (Bias Up)

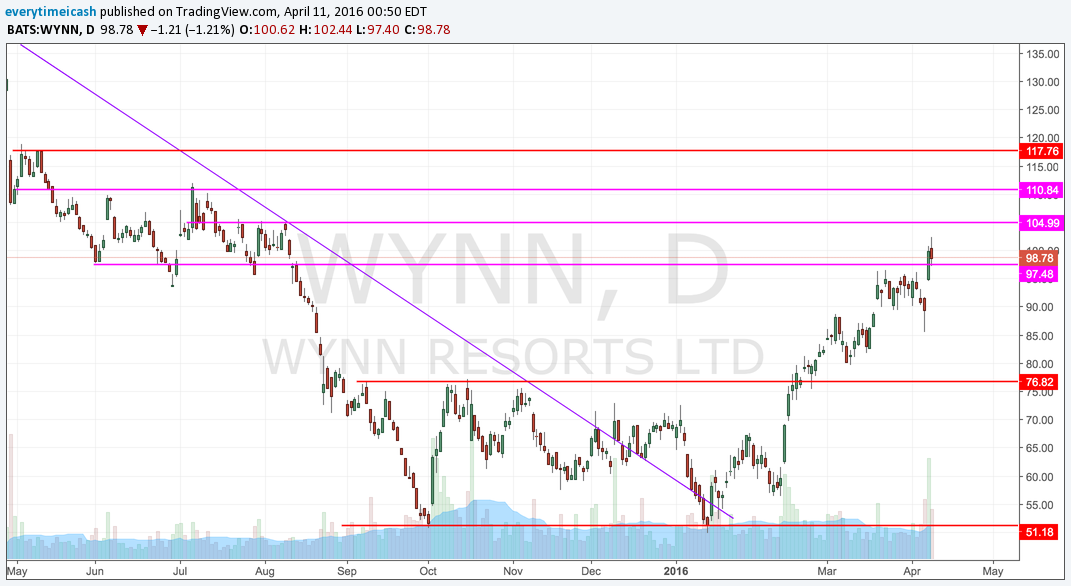
WYNN

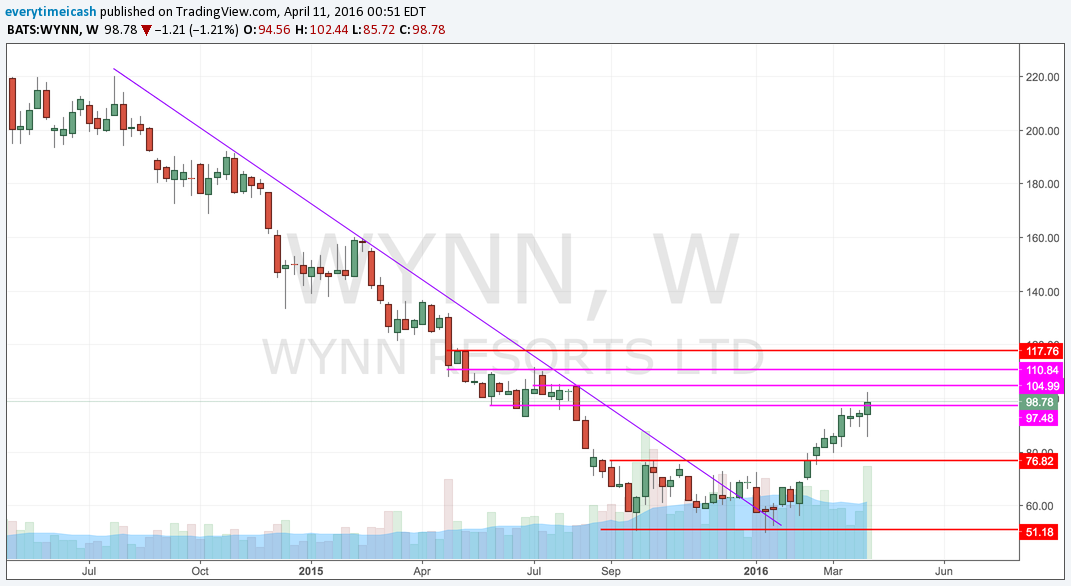
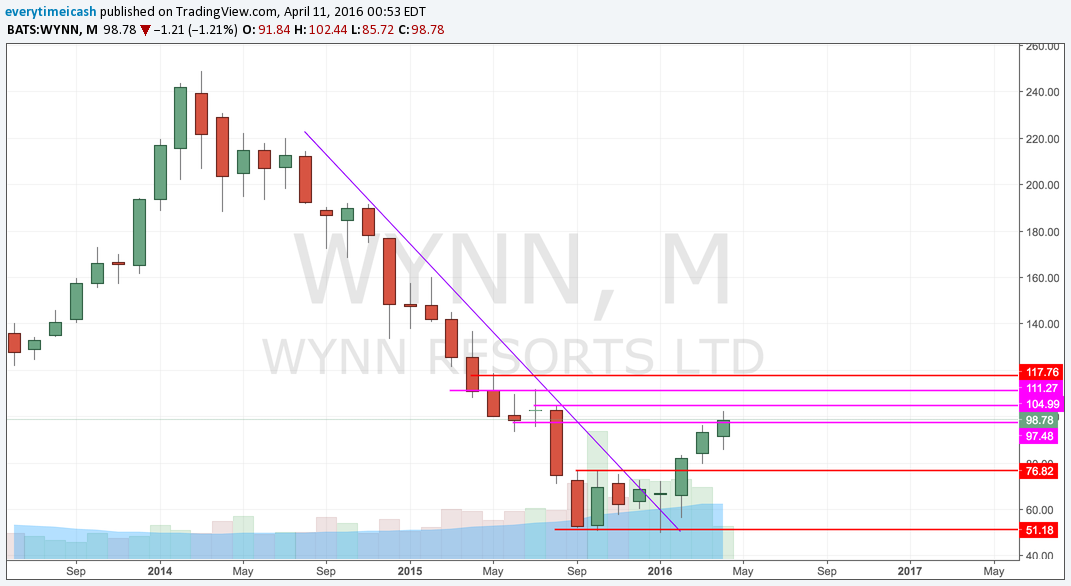
Ignore the "Fast Money" stupidity by the guy who has a 17% stop. Stick with trend until it's broken. Currently 97.5 has functioned as support and below that is the box breakout support of 96. Last week we saw some continued May C buying by the wise guys.

VMC

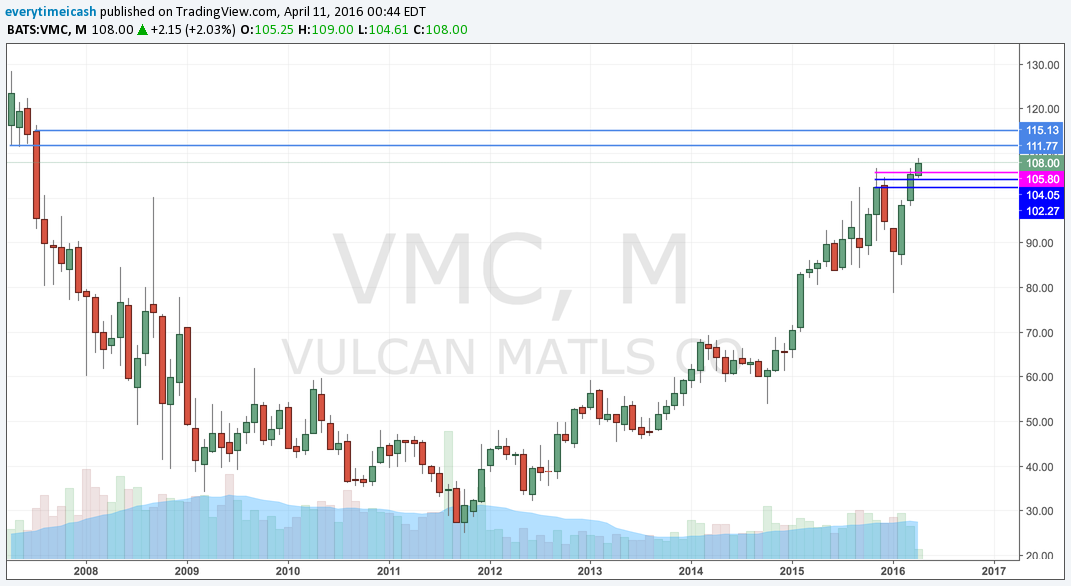
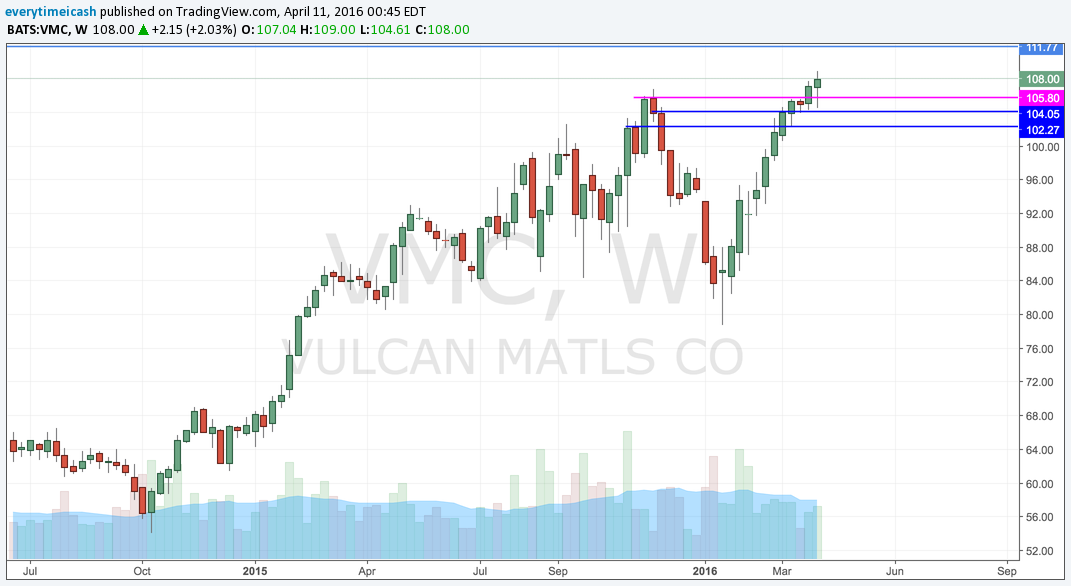
My favorite materials company out there. Period.

China

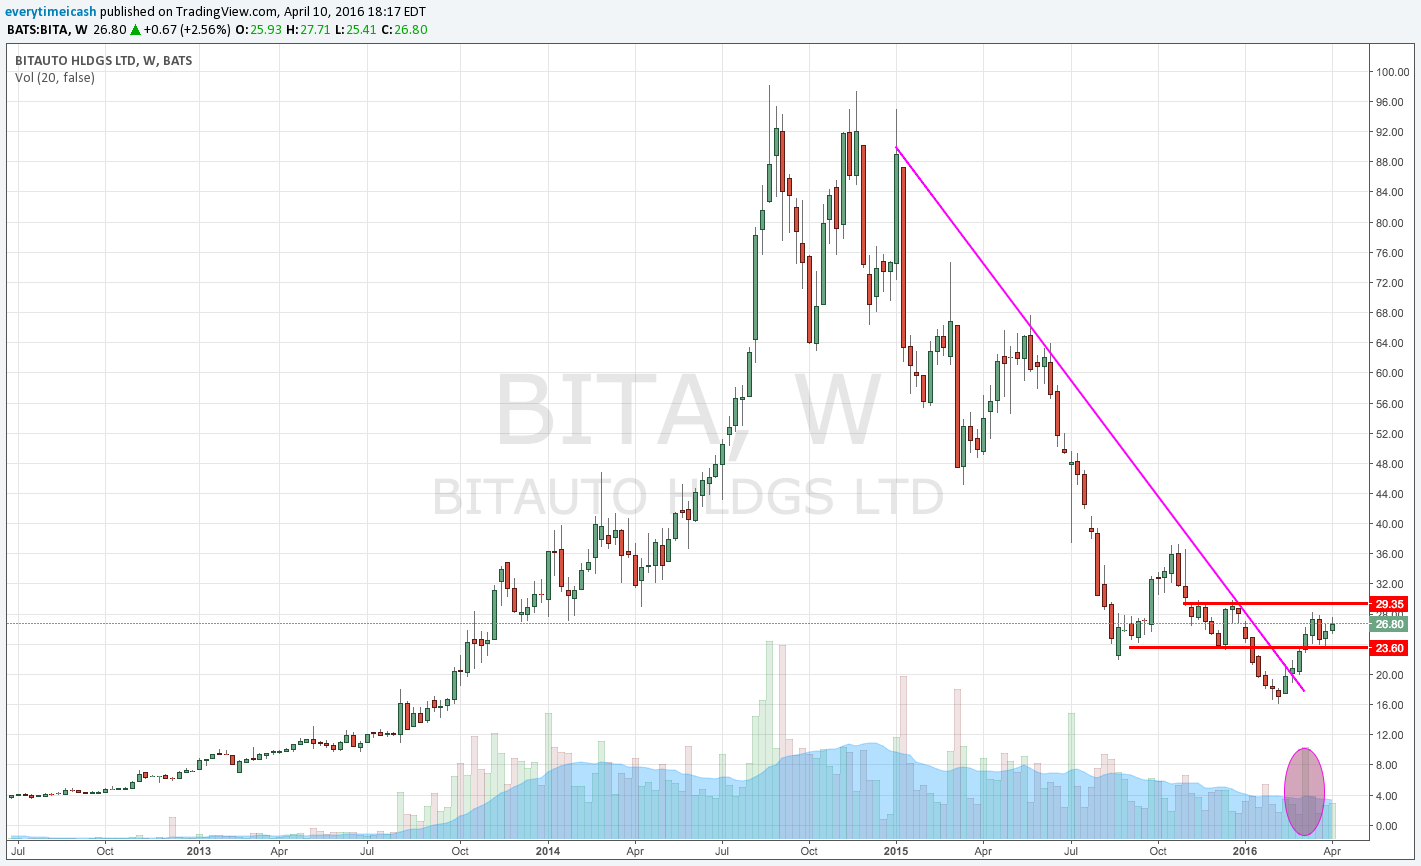
Some China names have recently caught a bid and my favorite setup at the moment is potentially BITA. 

This is a former high flyer with recent accumulation volume. 

XOP

This showed a break in 2014 and has been in a downtrend since. As of late however, it has showed some signs of stabilization in an attempt to get back to its down trend. 

Basing for a potential break to the downtrend.