It's in the Game ($EA Earnings)

It's in the Game ($EA Earnings)

Electronic Arts (EA) is set to report Q2 results after the bell (released results last quarter at 4:00pm ET). The co has a conference call scheduled to follow at 5:00pm ET. Cap IQ Consensus estimates Q2 EPS of $0.43 (vs. $0.65 in 2Q15) w/revs of $1.09 bln (-4.8% y/y). 

Guidance

Q2

  • GAAP net revenue is expected to be approximately $915 million.
  • GAAP net loss is expected to be approximately ($51) million.
  • GAAP loss per share is expected to be approximately ($0.17).

FY17

  • Ending March 31, 2017 GAAP net revenue is expected to be approximately $4.750 billion (Reaffirm).
  • GAAP net income is expected to be approximately $809 million.
  • GAAP diluted earnings per share is expected to be approximately $2.56 (Prior guidance was $2.53)

Options Activity

  • Based on EA options, the current implied volatility stands at ~ 39%, which is 95% higher than historical volatility (over the past 30 days). Based on the EA Weekly Nov04 $77 straddle, the options market is currently pricing in a move of ~7% in either direction by weekly expiration (Friday).

TECHS:

Last week's downgrade took the wind out of the stock. Sellers responded with an aggressive drop below its rising 50-day moving average which has price in "no-man's land" ahead of earnings. Next key support is the 200-day simple ma near 73.

Alphabetical ($GOOGL Earnings)

Alphabetical ($GOOGL Earnings)

Alphabet (GOOGL, GOOG) is set to report Q3 earnings tonight after the close with a conference call to follow at 4:30pm ET. GOOGL reported Q2 results at 4:01pm, the company does not guide. 

Current Capital IQ consensus stands at EPS of $8.60 on Revenue of $22.03 bln.

Shares of GOOGL hit an all time high of $838.50 on Monday but we have seen some profit taking ahead of tonight's report as the stock has pulled back to $820. The company is coming of an impressive Q2 in which it was able to accelerate revenue growth to over 20% for the first time in three years.

The growth was driven by Google website revenues as strength in the mobile and YouTube segments provided a boost. The rise in mobile has also boosted the growth in partners and website TAC which will be an area to watch.

The all time high will certainly be in play, especially when one views the Forward P/E of 20.5x being reasonable for a co that is posting 20%+ revenue increases despite being a $20+ bln a quarter company, no easy feat. A miss by GOOGL should prove interesting with the $783.50 Post-Q2 results being a key level of support. A break of this will send the shares to the $760 with the 200-sm ($757.29) in play.

Key Metrics

  • Revenue Growth
  • Operating Margins
  • Aggregate Paid Clicks-  Q3 expected to increase approx 26% y/y; Q2 +29%;-Q1 +29%;Q4 +31%; Q3 +23%.
    • Paid Clicks on Google websites- Q2 +37%;Q1 +38%; Q4 +40%; Q3 +35%.
    • Paid clicks on member sites- Q2 0%;Q1 +2%; Q4 +2%; Q3 -5%.
  • Aggregate cost per click- Q3 is expected to decline approx 5% y/y; Q2 -7%; Q1 -9%; Q4 -13%; Q3 -11%
    • CPC on Google sites- Q2 -9%; Q1 -12%; Q4 -16%; Q3 -16%.
    • CPC on member sites- Q1 -8%; -8%; Q4 -8%; Q3 -4%.
    • If curious: Cost-per-click is defined as click-driven revenue divided by our total number of paid clicks and represents the average cost we charge advertisers for each engagement by users.

Q2 Recap

GOOGL reported Q2 (Jun) earnings of $8.42 per share, $0.38 better than the Capital IQ Consensus of $8.04. Revenues rose 21.3% year/year to $21.5 bln vs the $20.77 bln Capital IQ Consensus.

RESULTS

GOOGL/GOOG beats by $0.46, beats on revs  

  • Reports Q3 (Sep) earnings of $9.06 per share, $0.46 better than the Capital IQ Consensus of $8.60; revenues rose 20.2% year/year to $22.45 bln vs the $22.04 bln Capital IQ Consensus.
  • Non-GAAP Operating Margin 34% compared to 33% prior year
  • Other Bets revenue $197 mln compared to $141 mln in prior year
    • Other Bets operating loss ($865) mln compared ot ($980)mln in prior year
  • Cost of revenues as %- 39% compared to 38% in prior year
  • Google Website Revenue Growth 23%
  • Google Network Members Websites 1%
  • Google Other Revenues 39%
  • Google segment Revenues 20%
  • TAC as a % of revenue 21% compared to 21% in the prior year
  • Aggregate Paid Clicks-
    • Q3 +33%, expected to increase approx 26% y/y; Q2 +29%;-Q1 +29%;Q4 +31%; Q3 +23%.
    • Paid Clicks on Google websites- Q3 +42%; Q2 +37%;Q1 +38%; Q4 +40%; Q3 +35%.
    • Paid clicks on member sites- Q3 +1%; Q2 0%;Q1 +2%; Q4 +2%; Q3 -5%.
  • Aggregate cost per click-
    • Q3 -11%, expected to decline approx 5% y/y; Q2 -7%; Q1 -9%; Q4 -13%; Q3 -11%
    • CPC on Google sites- Q3 -13%; Q2 -9%; Q1 -12%; Q4 -16%; Q3 -16%.
    • CPC on member sites- Q3 -14%; Q1 -8%; -8%; Q4 -8%; Q3 -4%.

Bezos ($AMZN Earnings)

Bezos ($AMZN Earnings)

Online retail giant and heavyweight tech name Amazon.com (AMZN) is set to report Q3 earnings today after the close today followed by conference call at 5:30pm ET. 


Current Quarter Expectations: Operating income and revenues estimates are usually near the upper end of the company's guidance—which tends to be conservative—but headed into this quarter, operating income estimates are above the high end of outlook provided with the Q2 earnings release. Q3 is a typically a lower operating income quarter as the company prepares for the holiday peak in Q4. 

Look for the following:

  • Customer/seller growth metrics (discussed during the conference call)

    • Q2 Seller units/third party were 49% of paid units (48% last qtr)

    • Q2 unit growth metric was 28% (slightly higher than 27% from prior qtr and well above 22% reported prior year)

  • Based on AMZN options, the current implied volatility is 2x higher than the historical volatility (over the past 30 days). The 1-day event volatility is ~50 points (6%).

  • Secondary playsRetail focus - WMT (reports earnings Nov 17 before the open), ETSY (earnings Nov 1; AMZN competing service - Handmade service), BBY (earnings expected mid November), W (earnings Nov 8 before the open), EBAY (reported last week), BABA (earnings late October). Shipping - UPS and FDX (ATSG new partner). Cloud -- SKYY (ETF). Food delivery(been expanding Prime Now local restaurant delivery service): Grubhub (GRUB), Yelp (YELP) and Square (SQ). Prints service: Shutterfly (SFLY), Kodak (KODK).

  • ETF/index components: S&P500 (SPX) 1.8%, Retail HOLDRS Trust (RTH) 18%, Consumer Dis Spdr (XLY) 14%, US Consumer Services (IYC) 11%, PowerShares QQQ (QQQ) 7.6%, First Trust Cloud ETF (SKYY) 5%, SPDR Retail (XRT) 1.3%

RESULTS:

  • Reports Q3 (Sep) earnings of $0.52 per share, $0.30 worse than the Capital IQ Consensus of $0.82; revenues rose 29.0% year/year to $32.71 bln vs the $32.65 bln Capital IQ Consensus; operating income $575 mln vs. $50-650 mln guidance and $670 mln estimates.
    • NA net sales +26% to $18.9 bln; GAAP operating income 37% to $255 mln
    • Int'l net sales 28% to $10.6 bln; GAAP OI ($541) mln.
    • AWS net sales +54.5% to $3.2 bln; GAAP operating income +101% to $861 mln. 
  • Co issues in-line guidance for Q4, sees Q4 revs of $42.0-45.5 bln vs. $44.65 bln Capital IQ Consensus. Operating income is expected to be between $0 and $1.25 billion, below estimates, vs. $1.1 billion in fourth quarter 2015.


Rigged ($XOM Earnings)

Rigged ($XOM Earnings)

Oil and gas major-giant giant Exxon Mobil (XOM) is scheduled to release its Q3 earnings results tomorrow on Oct 28 before the opens with a conference call to follow at 9:30 am ET the same day.

Capital IQ Consensus calls for EPS of $0.60 and a revenue decline of 10.0% to $60.6 bln, compared to EPS of $1.01 on revenue of $67.3 bln in 3Q15

The company announced an oil discovery in offshore Nigeria; potential recoverable resource of between 500 mln & 1 bln barrels of oil. Some color about this find was in the press release. Color on this tomorrow will be good.

In other news that just came out a couple of hours ago, Exxon Mobil is mulling setting up a full-scale trading division, according to the FT.

XOM Chart: https://www.tradingview.com/x/ceKwvDIR/

Peers include: PTR, EC, TOT, SNP, STO, E, OXY, SSL, MITSY, ECA, YPF, PZE, RDS.A, BP, CVX


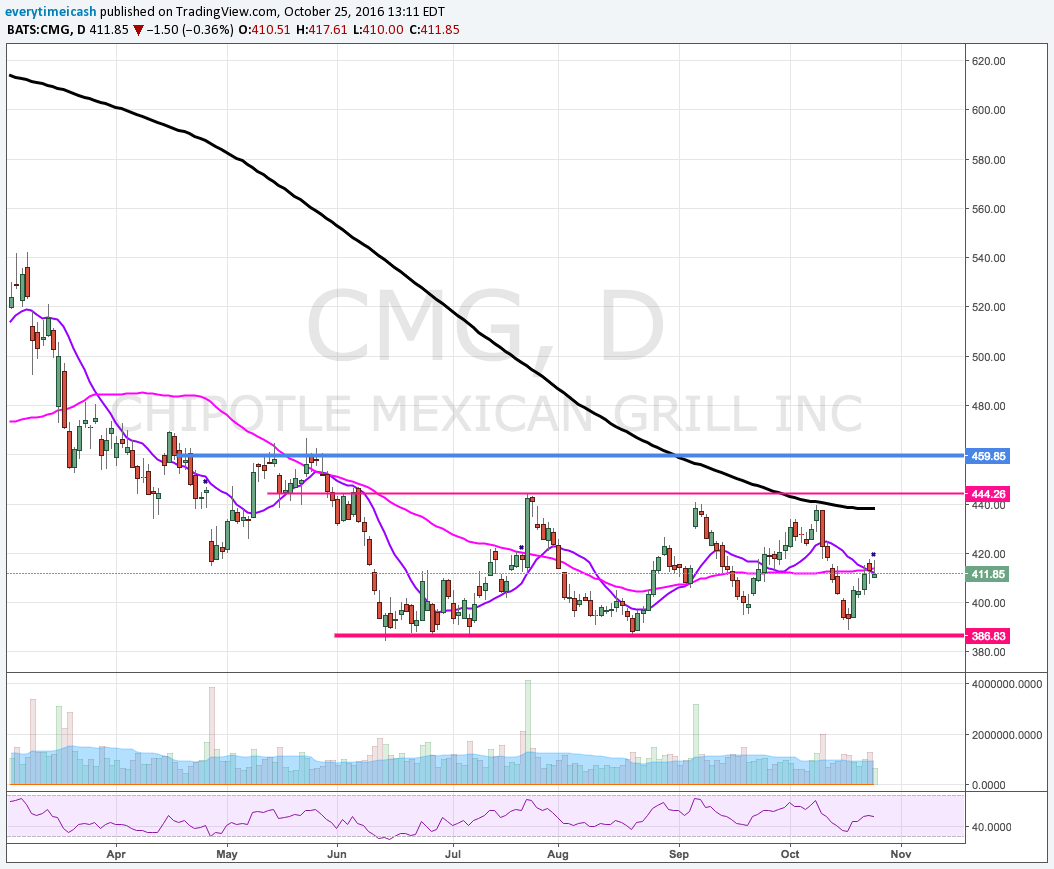
Dirty Burrito; $CMG Earnings

Dirty Burrito; $CMG Earnings

CMG is expected to report Q3 earnings tonight after the close. There is a conference call scheduled for 16:30 (the company typically does not provide any EPS or revenue guidance).

Capital IQ consensus calls for Q3 EPS of $1.62 (versus $4.59 last year) on revenue of $1.048 bln (-13% YoY).

  • For Q3, the Street is expecting Q3 comps to decline by 18%

  • The company is still seeing the impacts of the E Coli crisis which negatively impacted comps and earnings.

  • FY16 Guidance: For 2016, co expects 220 - 235 new restaurant openings & an effective full year tax rate of ~ 38.4%

Pershing Square 9.9% Stake

  • On September 6, shares spiked as much as 8% after Pershing Square disclosed a 9.9% active stake, intends to engage in discussions w/ mgmt. and the Board.
  • On October 21, Pershing Square affirmed the 9.9% active stake, disclosed the purchase of 2,328,250 shares of Common Stock for an aggregate purchase price of $947,367,983 pursuant to forward purchase contracts described in the Original 13D

PEERS TO WATCH: JACK, PNRA, BWLD, DPZ

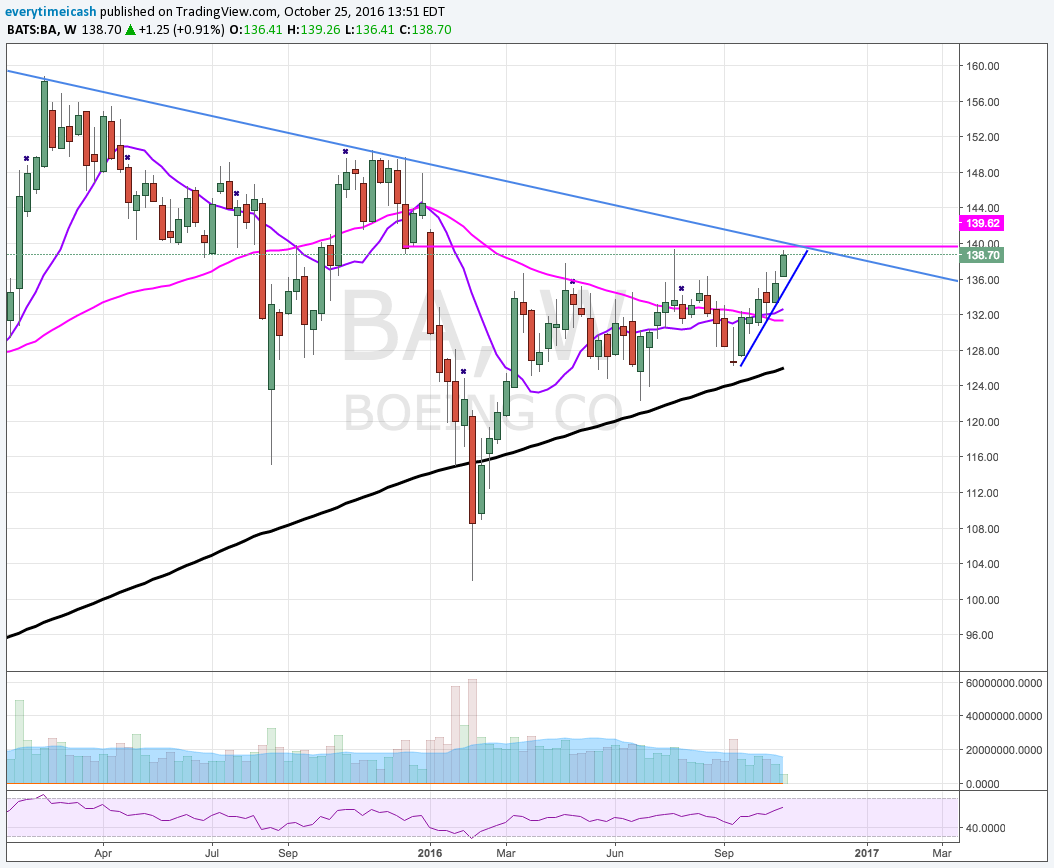
$BA Earnings

$BA Earnings

Boeing will report Q3 results before the bell tomorrow (released results last quarter at 7:30am ET). The co has a conference call scheduled to follow at 11:30am ET. 

Cap IQ Consensus estimates Q3 EPS of $2.62 (vs. $2.52 in 3Q15) w/revs of $23.60 bln ( -8.7% y/y).

In the Q2 earnings release, co lowers FY16 EPS to $6.10-6.30 from $8.15-8.35 vs. the $8.50 consensus; reaffirms FY16 revs of $93-95 bln vs. the $93.84 bln Consensus; reaffirms 740-745 commercial airplane deliveries but lowers operating margin to 4.5-5% from 9%.

BA was initiated with an Outperform at Robert W. Baird; tgt $161. Firm believes the FCF dynamic at BA continues to be underappreciated especially with $25 billion in FCF being generated during 2017-19 with ~$17 billion available for buybacks after dividends. Ramping build rates, seven-year backlog visibility with record low deferral rates, stable R&D costs, and productivity improvements lend to returning significant cash to shareholders. Their price target is $161 based on 11x their 2018 FCF estimate. Buying the pullback in BA shares as bear points priced in at current levels (October 6th).


Boeing reports Q3 (Sep) results, beats on revs; reaffirms FY16 EP ex-tax benefit; raises rev on higher commercial deliveries  

  • Reports Q3 (Sep) earnings of $3.51 per share, including $.98 in favorable tax items, may not be comparable to the Capital IQ Consensus of $2.62; revenues fell 7.5% year/year to $23.9 bln vs the $23.6 bln Capital IQ Consensus.
  • Co issues reaffirms guidance for FY16, sees EPS of $6.10-6.30 ex-$0.70 favorable tax adjustment vs. $6.29 Capital IQ Consensus Estimate; raises FY16 revs $500 mln to $93.5-95.5 bln vs. $94.04 bln Capital IQ Consensus on higher commercial deliveries: to 745-750 from 740-745. 

Call Notes

  • Co anticipates modest U.S. Federal defense spending growth in the next five years.
  • Regarding the 747 program, the co is encouraged by modest recovery in the air cargo market.
  • Co delivered 188 commercial airplanes in the quarter. 
  • Defense, space and security orders valued at $6 billion with a backlog of $53 billion
  • 38% of business comes from customers outside of the United States.
  • Co paid $700 mln in dividends, repurchased 51 million shares during the quarter for a total of $6.5 billion.
  • So far in 2016 co has added 17 net new 777 orders, on track to transition to 7 per month.
  • Encouraged by recent Qatar airways decision for 10 777s. 
  • Co will provide FY17 guidance during the Q4 earnings call.


Slicing the Competition ($AAPL Earnings Preview)

Slicing the Competition ($AAPL Earnings Preview)

Apple, will report Earnings after Tuesday's close.

  • Investors are anxious to see what type of sell-through Apple has achieved with its new iPhone 7 and what the company says about demand expectations for the fiscal first quarter, which will encompass the holiday selling period
  • Shares of AAPL have surged 21% since the company's better-than-feared fiscal third quarter report in July.  Investors will have higher expectations from AAPL's earnings which provides guidance. Failure on either front could lead to some material downside for the stock, which would act as a major drag on the broader market.
 

Expectations have ratcheted up in recent weeks on the back of Samsung's disclosure that it has stopped production, and sales, of its Galaxy Note 7

 
  • International sales accounted for approximately 60% of revenues in fiscal 2015, so investors will be looking for remarks on global demand trends and the impact of foreign exchange
  • Apple is the most heavily-weighted stock in the market-cap weighted S&P 500, the most heavily-weighted stock in the market-cap weighted Nasdaq 100, and the seventh highest-priced stock in the price-weighted Dow Jones Industrial Average, so it clearly has market-moving capability
  • With a huge installed base of Apple products around the globe (iPhone, iPad, Mac, iTunes, iPod, and Apple Watch), the company's performance is watched closely as a gauge of consumer spending activity
     

Key Earnings Items

  • Any color on the iPhone 7 release as a demand driver
  • Average selling price and gross margin trends
  • Apple's ability to monetize its installed base (viewed through revenue growth in the services businesses)
  • The performance of its "Other Products" (Apple Watch, iPod, and Apple Pay)
  • The performance, and outlook, for its three largest geographic regions
    • Americas segment accounted for 40.2% of net revenue last year
    • Greater China accounted for 25.1% of net revenue last year (China is seen as company's most important growth market)
    • Europe accounted for 21.5% of net revenue last year
       

Stocks Affected
 

Smartphones

  • Samsung (SSNLF)
  • Blackberry (BBRY)
     

Component suppliers

  • Broadcom (AVGO; Apple more than 20% of fiscal 2015 net sales)
  • Cirrus Logic (CRUS; Apple was 72% of fiscal 2015 sales)
  • InvenSense (INVN; Apple 30% of fiscal 2015 net sales) 
  • Qualcomm (QCOM) 
  • NXP Semiconductors (NXPI)
  • Micron Technology (MU)
  • Analog Devices (ADI)
  • Skyworks Solutions (SWKS)
  • On Semiconductor (ON)
  • Western Digital (WDC)
  • Seagate Technology (STX)
     

Wearables 

  • Fitbit (FIT)
  • Garmin (GRMN)

Wireless carriers 

  • AT&T (T)
  • Verizon (VZ)
  • T-Mobile (TMUS)
  • Sprint (S)
  • China Mobile (CHL)
     

Related ETFs

  • PowerShares QQQ ETF (QQQ)
    • AAPL is top-weighted holding at 10.77% of assets
  • SPDR S&P 500 ETF (SPY)
    • AAPL is top-weighted holding at 3.24% of assets
  • SPDR Dow Jones Industrial Average ETF (DIA)
    • AAPL is tenth-weighted holding at 4.22% of assets
  • Technology Select Sector SPDR ETF (XLK)
    • AAPL is top-weighted holding at 13.56% of assets


Uncharted Waters Week of 8/29/16

Uncharted Waters Week of 8/29/16

Many individuals like to make predictions and like to try their luck with where they think the market will head. I try to avoid that game and simply trade what I see. Though last week was the first week where it "felt" like we may be heading lower it certainly won't be the last. That said, there are still plenty of strong stocks out there and relinquishing gains will not come easy for the bears this go around. As far as indexes go, I'm focusing primarily on the IWM and the NASX as they've been the leaders of late. 

INDEXES


STRENGTH STILL REMAINS:


EARNINGS

Two names you want to keep your eye out for tomorrow are PANW and VEEV. PANW has seen UOA as of late and VEEV has been a serial performer as of late. 

WEAKNESS POTENTIAL

ULTA & SPLK have been strong until their earnings report last week. Look for signs of continued roll over or for a new base to form.

Click here to listen to my podcast and learn about my theory on the similarities between relationships and the stock market


Mouse Ears ($DIS Earnings)

Mouse Ears ($DIS Earnings)

Analysts have a consensus EPS estimate of $1.61 for the third quarter, which was $0.01 higher than their predictions of $1.60 90 days ago. Disney will report its third quarter results after the market closes.


    More Stars ($YELP Earnings)

    More Stars ($YELP Earnings)

    The consensus estimates calling for a net loss of $0.07 per share on $169.82 million in revenue for the quarter. Yelp posted a net loss of $0.02 per share on revenue of $133.91 million in the same period of last year.


    Electric Overdrive ($TSLA Earnings)

    Electric Overdrive ($TSLA Earnings)

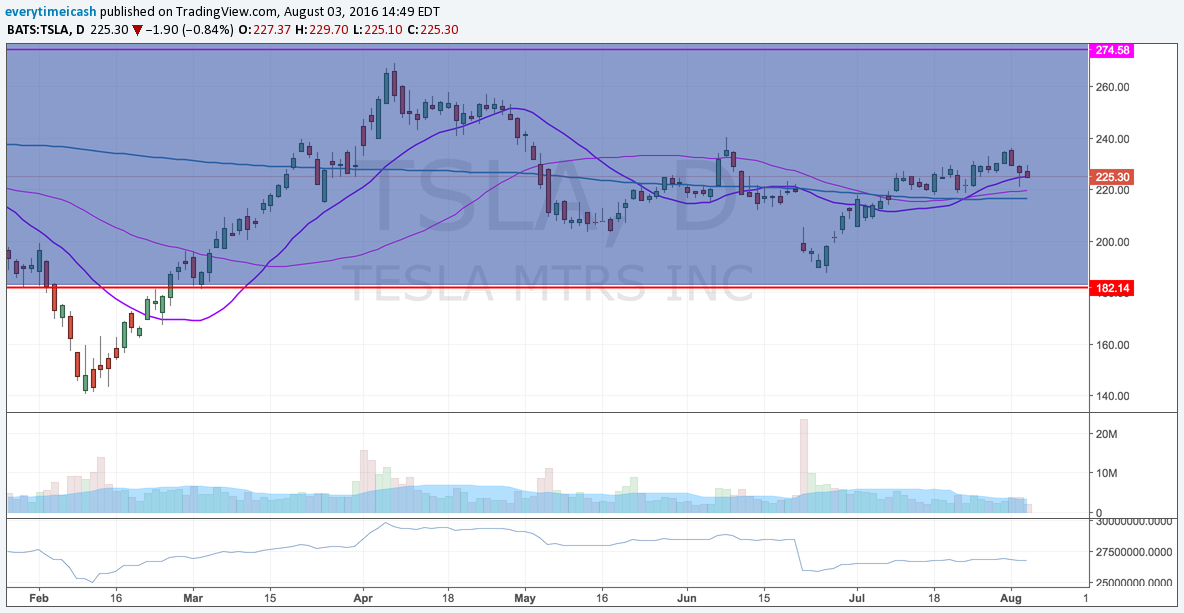
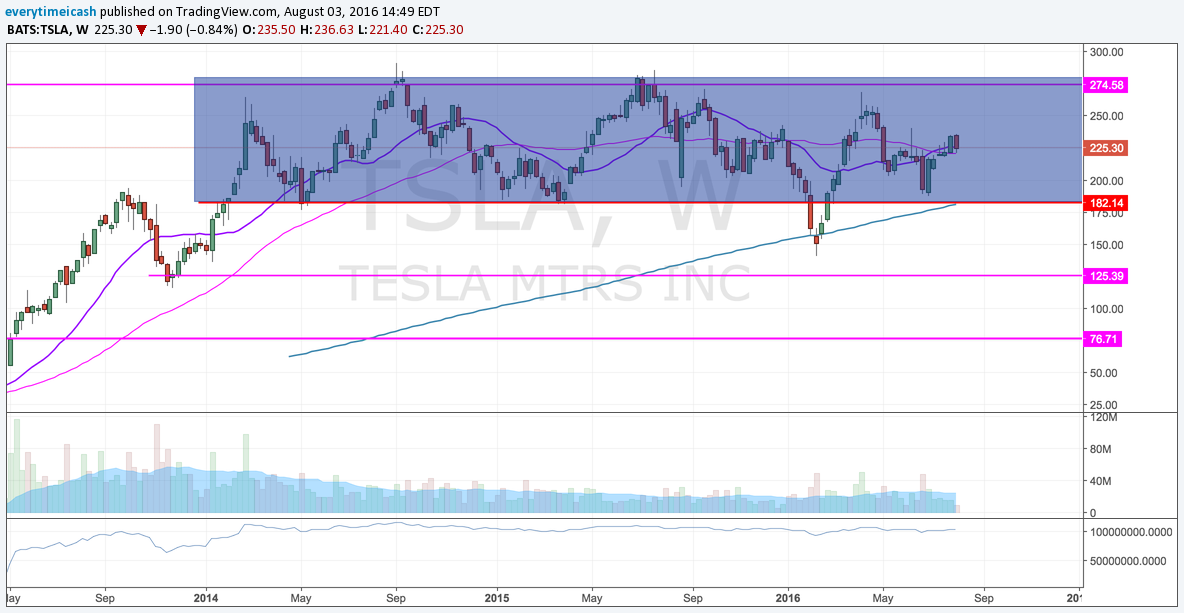
    Tesla (TSLA) will report Q2 results in shareholder letter on its website after the bell and host a call at 17:30.

    Tesla is expected to report Q2 non-GAP EPS of ($0.65) vs. ($0.48) last year with non-GAAP rev up 38% to $1.65 bln.

    • Tesla delivered 14,370 vehicles during Q2 vs. 17,000 guidance. Production came in 18,345 vehicles vs. 20,000 guidance.
    • Tesla said it will produce and deliver 50,000 vehicles in the second half of the year, which effectively lowered 2016 delivery guidance to just under 80K (79.2K) from 80-90K previously.
      • Prior FY16 guidance also called for 30% non-GAAP Model S gross margin and 25% Model X non-GAAP gross margin by year end, cap-ex $2.25 bln and non-GAAP op-ex +20-25%.         


    Tesla has consistently missed production and delivery targets.

    • Still, Tesla investors look at the big picture as demand for its electric vehicles remains strong.
    • There is a great deal of skepticism that Tesla will hit its increased (and seemingly impossible) production plan: 500K Model S, X & 3 vehicles by 2018.
    • July 26: Mobileye (MBLY) announces its relationship with Tesla won't go beyond its current EyeQ3 chip. 


    The stock has been very resilient despite added risks as investors give Elon Musk the benefit of the doubt.


    Click here to listen to my podcast and learn about my theory on the similarities between relationships and the stock market

    Nice Tan ($FSLR Earnings)

    Nice Tan ($FSLR Earnings)

    First Solar (FSLR) is set to report earnings tonight after the close with a conference call to follow at 4:30pm ET. FSLR reports at 4:05pm.

    Current Capital IQ consensus stands at EPS of $0.55 on Revenues of $862 mln.

    The FSLR revenue recognition model makes it extremely difficult for analysts to provide accurate quarterly estimates.  The company has been able to handily beat EPS expectations by an average of $1.03. Revenue has been a little less friendly with two big misses and three big beats over the past five quarters.

    The annual projections remain the primary focus for the underlying health of the company and that is where we will be looking to judge the overall performance and outlook. Shares of FSLR have had a difficult 2016. The stock got out of the gates strong hitting a two year high of $74.29 on March 18. But the shares have tumbled 33% since that high water mark.

    2016 Guidance

    • Net Sales $3.8-4.0 bln was reaffirmed in Q1
    • Gross Margin 18-19% (Prior 17-18%)
    • Operating Expenses $380-400 mln (Reaffirmed)
    • Operating Income $300-370 mln (Prior $260-330 mln)
    • EPS $4.10-4.50 (Prior $4.00-4.50)
    • Net Cash Balance $1.9-2.2 bln (Reaffirmed)
    • Operating Cash Flow $500-700 mln (Prior $400-600 mln)
    • CapEx $300-400 mln (Reaffirmed)
    • Shipments 2.9-3.0 GW (Reaffirmed)

    TECHS:


    Click here to listen to my podcast and learn about my theory on the similarities between relationships and the stock market

    CAR Accident ($CAR Earnings)

    CAR Accident ($CAR Earnings)

    Avis Budget (CAR) is set to report Q2 earnings tonight after the close with a conference call to follow tomorrow morning at 8:30am ET. CAR reported Q1 results at 4:15pm. Current Capital IQ consensus stands at EPS of

    Shares of CAR have had a solid run since reporting Q1 results in early May. The co missed its EPS by 22 cents but revenues were in line and, most importantly, it guided FY16 revenue above the consensus. The primary driver, and what attracted investors, was commentary from the company that it was starting to see a turn around in the pricing environment for the troubled car rental business.

    This stock fell from the $50 area in October of 2015 all the way to $22. So the recent upward trend allowed the stock to recapture approx 55% of its losses. But we are seeing the stock under pressure today as it has given up nearly 5% ahead of today's report. Shares are down approx 12% over the past week. This suggests that investors remain cautious on the name and are taking profits after buying low.

    CAR will need to show a continued improvement in pricing to entice more investors into the name. It does have some solid support below at the 200-sma ($31.90) and the $33-34 area which both linger just below. Also we would keep an eye on Hertz (HTZ) which will trade closely with CAR on the news.

    Key Metrics

    • Pricing- CAR expects it to decline 1% in FY16. Pricing in Q1 declined by 5% so investors are looking for a deceleration in the price decline.
    • Rental Days- FY16 guidance is for this to increase 2-4%. Rental Days increased by a healthy 8% in Q1.
    • Per Unit Fleet Costs- Expected to be $280-290 per month in 2016. This figure ran hot in Q1 as it came in at $312 per month, up 6% y/y.

    Guidance

    • Co expects FY16 EPS in the range of $2.70-3.30, excluding non-recurring items, vs. then-$2.97 Capital IQ Consensus Estimate. Revenue is expected to come in the range of $8.75-8.90 bln which was an upgrade from the prior outlook of $8.70-8.85 bln vs. then-$8.7 bln Capital IQ Consensus.
    • Car reaffirmed its FY16 EBITDA expectations of $820-900 mln.
    • The Company also expects that it will generate $450 to $500 million of free cash flow in 2016, and that it will repurchase $300 to $400 million of common stock in 2016.

    Q1 Recap

    • CAR reported Q1 (Mar) loss of $0.28 per share, excluding non-recurring items, $0.22 worse than the Capital IQ Consensus of ($0.06). Revenues rose 1.7% year/year to $1.88 bln vs the $1.88 bln Capital IQ Consensus, +3% in constant currency, primarily due to an 8% increase in rental days (5% excluding the acquisition of Maggiore).
    • First quarter Adjusted EBITDA was $44 million.
    • Results benefited from increased rental volumes, offset by reduced pricing, higher per-unit fleet costs and a $33 million negative impact from currency movements, including losses on currency hedges.


    Click here to listen to my podcast and learn about my theory on the similarities between relationships and the stock market.

    Daily Dose ($VSI  Preview)

    Daily Dose ($VSI Preview)

    Vitamin Shoppe will report Q2 results tomorrow morning 

    • Vitamin Shoppe (VSI) will report Q2 results tomorrow morning and host a call at 8:30.
    • VSI is expected to report Q2 EPS of $0.59 vs. $0.57 last year with rev +2.6% to $330.7 mln on ~flat comps.
    • Co previously guided for FY16 adj. EPS of $2.25-2.45 with comps flat to up in the low single digits.
    • VSI was testing resistance near the $32 level when peer/competitor GNC (GNC) missed Q2 comp estimates and suspended earnings guidance last week.
    • VSI has quickly fallen to support near the $8 level ahead of this report.

    Click here to listen to my podcast and learn about my theory on the similarities between relationships and the stock market.


    Just A Little Bit ($FIT Earnings)

    Just A Little Bit ($FIT Earnings)

    Fitbit (FIT) is set to report Q2 results tonight after the close with a conference call to follow at 5pm ET. FIT reported Q1 results at 4:05 pm. 

    Current Capital IQ consensus stands at EPS of $0.11 on Revenue of $577.9 mln.

    Shares of FIT have been building a base in this $12-14 area since reporting Q1 results back in early May. The stock is attempting to press above its 50-sma (13.40) ahead of tonight's report.

    Shares of FIT were able to rally to the $18 level ahead of Q1 results but weak Q2 guidance led to some profit taking and selling in the name. The Q2 EPS outlook of $0.08-0.11 was well below the $0.27 Capital IQ consensus at the time as higher investments in the company are taking its toll on the bottom line. FIT is expected to provide an update to its Q3 guidance on the call but expectations will be low as plans to launch new products in Q4 will have an impact on channel orders int he quarter. So an update to FY16 might be the more meaningful item to watch. If FIT were to see a negative response to a cautious Q3 outlook we would keep an eye on the FY16 guidance as that may provide more insight into the direction of FIT.

    Key Metrics

    • Revenue Growth- This has been declining over the past four quarters as economies of scale take its toll. But investors would like to see this steady ahead of the Q4 holiday season. Current Capital IQ consensus is calling for a 44% increase y/y. Revenue growth over the past four quarters has been Q1- 50.1%, 4Q15- 92.2%, 3Q15- 167.7%; 2Q15- 252.5%.
    • Margins- Gross Margin is expected to rebound to 48.0% in Q2. Q1 saw it fall 320 bps to 46.6%; EBIT Margin fell to 7.3% from 27.5% as higher operating expenses weighed heavily on the bottom line.
    • Inventory- Q1 saw inventory pick up 54% (compared to the 50% revenue increase). With churn to new products expected in Q3 investors will be closely watching how well this was managed.
    • Devices Sold- FIT sold 4.8 mln devised in Q1.

    Guidance

    • Q2
      • FIT issued mixed guidance for Q2, seeing EPS in the range of $0.08-0.11 vs. then-$0.27 Capital IQ Consensus Estimate. For revenue FIT forecast Q2 revs of $565-585 mln vs. then-$535.17 mln Capital IQ Consensus Estimate.
      • Non-GAAP Gross Margin expected to be 48.0%.
    • FY16
      • FIT revised its EPS expectations higher which might point to only a temporary increase in operating expense as it ramps up delivery of new products. For FY16 it raised its EPS outlook to $1.12-1.24 (Prior gudiance was $1.08-1.20), excluding non-recurring items, vs. then-$1.13 Capital IQ Consensus Estimate. FIT also raised its FY16 revenue outlook to the range of $2.5-2.6 bln (Prior $2.4-2.5 bln) vs. then-$2.45 bln Capital IQ Consensus Estimate.
      • Non-GAAP Gross Margin was reaffirmed to be in the range of 48.5-49.0% (Reaffirm).

    Q1 Recap

    • FIT reported Q1 (Mar) earnings of $0.10 per share, excluding non-recurring items,$0.07 better than the Capital IQ Consensus of $0.03. Revenues rose 50.1% year/year to $505.4 mln vs the $440.03 mln Capital IQ Consensus.
      • U.S. comprised 70% of 116 revenue; EMEA 15%, APAC 11%, and Other Americas 4%
      • U.S. revenue grew 33% year-over-year; EMEA 113%, APAC 142%, and Other Americas 74%
      • Fitbit Blaze and Alta, selling a million units each in the latter part of the quarterQ

    Click here to listen to my podcast and learn about my theory on the similarities between relationships and the stock market.

    Primed ($AMZN Earnings Preview)

    Primed ($AMZN Earnings Preview)

    Current Quarter Expectations: As usual, operating income and revenues estimates are near the upper end of AMZN's prior guidance. 

    Alphabetical Order ($GOOGL $GOOG Earnings Preview)

    Alphabetical Order ($GOOGL $GOOG Earnings Preview)

    Alphabet (GOOG, GOOGL) is set to report Q2 results tonight after the close with a conference call to follow at 4:30pm ET. 

    Current Capital IQ consensus stands at EPS of $8.04 on Revenue of $20.77 bln.

    • Q1 GOOGL saw one of the top and bottom line misses (GOOGL does not guide) but the strength of its core business remained evident and a pick up in revenue at some of its 'Other' business units was encouraging for investors. Growth trends remain positive in mobile search, YouTube, and programmatic which should help drive results. Investors would like to see GOOGL produce a beat similar to FB.
    • The stock has been trying to break out ahead of the report as expectations are high. GOOGL will need to meet these expectations in order to rally back to the $800 level for the first time since February.
    • With regards to FB it should be noted that GOOGL's forward P/E stand at 19.3x compared to 25.2x for FB. As arguably the two best tech companies on the planet at the moment these valuations will be watched closely

    Key Things to Watch

    • Revenue Growth
    • Operating Margins
    • Aggregate Paid Clicks- Q1 was down 3% q/q and up 29% y/y; Q4 increased 22% on Google Sites.
    • Q4 Aggregate Cost-Per-Click- 
    • U.K. Exposure

    TECHS:


    Click here to listen to my podcast and learn about my theory on the similarities between relationships and the stock market.