Coke Head Happiness ($KO Earnings Preview)

Coke Head Happiness ($KO Earnings Preview)

Coca-Cola (KO) is scheduled to report Q1 earnings tomorrow, before the opening bell, at 6:55 ET.

Current Consensus is for Q1 EPS of $0.44 (-8% Y/Y) on revenues of $10.2 bln (-5% Y/Y).

  • Current Consensus is for FY 16 EPS $1.95 on revs of $42.3 bln

  • Last quarter, KO beat EPS by $0.01/share w/ revs in-line. 

FY 16 Guidance from Last Q

  • Organic revs expected to grow 4-5%
  • Expects currency neutral income before tax, structurally-adjusted to grow 6-8% in 2016
  • Expects net impact of acquisitions and divestitures to be a four-five point headwind to net revs
  • Expect ~$2-2.5 bln in net share repurchases in 2016
  • Expect comparable currency neutral EPS growth of 4-6%
  • Expect to spend $2.5-3 bln on capex
  • Due to structural changes, co anticipates slightly higher COGS and SG&A
  • Co expect the benefit to equity income from Monster, Coca-Cola Beverages Africa and Coca-Cola European Partners to partially offset that impact at operating income, resulting in a three to four point negative structural impact to income before tax.
  • Look for updates on the below two l/t initiatives
  • $3 bln in productivity savings
  • Additional Notables from Last Quarter
  • Unit case volume was +3% YoY for Q4, and +2% YoY for FY 15
  • Global price/mix grew 2% for quarter and FY 15

TECHS


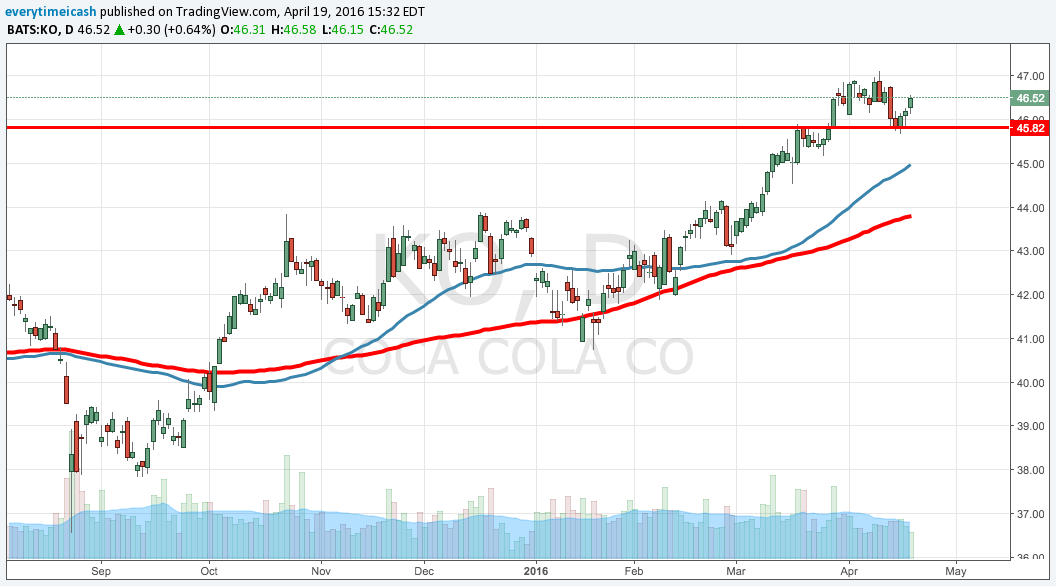
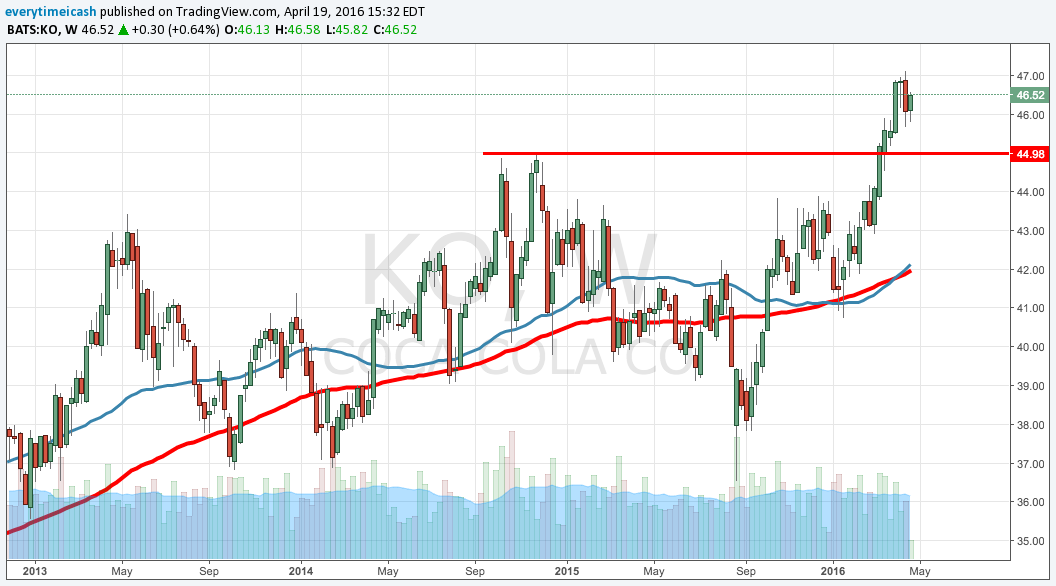
The stock price has been in a steady uptrend since, rallying bounce on the  50 day 3 times during the last quarter. The stock is currently up ~9% on the quarter and is near its 50 day.

Inside $INTC Earnings Release (4/19/16)

Inside $INTC Earnings Release (4/19/16)

Based on INTC options, implied volatility stands at ~ 25%, which is 57% higher than historical volatility (over the past 30 days). Based on the INTC Weekly Apr22 $31.50 straddle, the options market is currently pricing in a move of ~4% in either direction by weekly expiration (Friday).

Bank On It ($GS Earnings Preview 4/18)

Bank On It ($GS Earnings Preview 4/18)

GS reported Q4 (Dec) earnings of $4.68 per share compared to the Consensus of $3.62; revenues fell 5.5% year/year to $7.27 bln vs the $7.04 bln Consensus.


    Chill ($NFLX #Earnings 4/18/16)

    Chill ($NFLX #Earnings 4/18/16)

    Netflix ($NFLX) is set to report Q1 results tonight after the close with consensus at EPS of $0.03 on Revenue of $1.965 bln. 


    Big Blue ($IBM #Earnings Preview)

    Big Blue ($IBM #Earnings Preview)

    Q4 Recap: IBM beat on Q4 non-GAAP EPS of $4.84 vs the $4.81 Capital IQ Consensus and reported revenues in-line at $22.06 bln.

    Who Said Anything About Oil? 4/18 Weekly Setups

    Who Said Anything About Oil? 4/18 Weekly Setups

    SPY

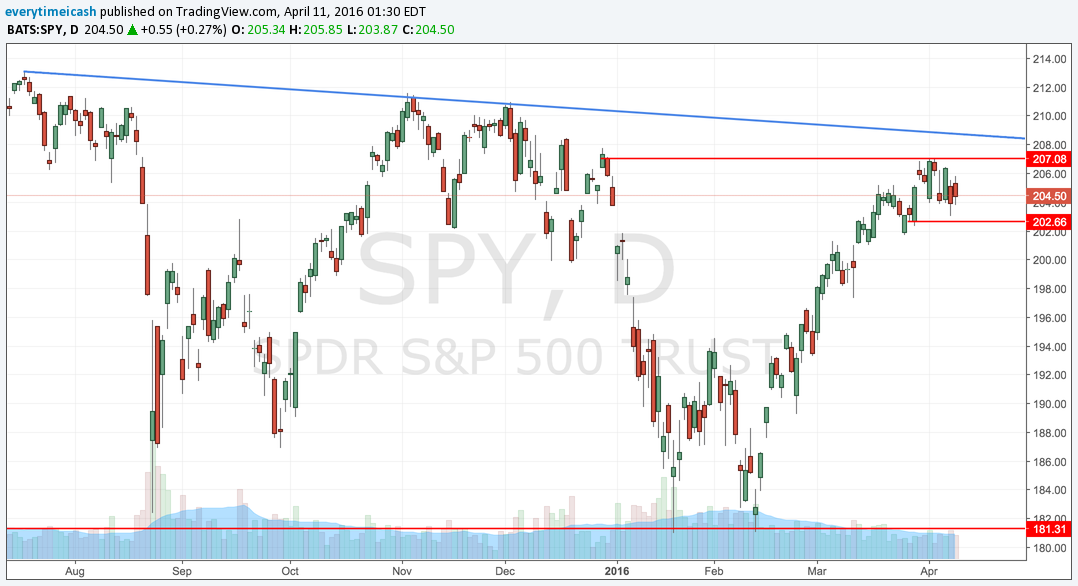
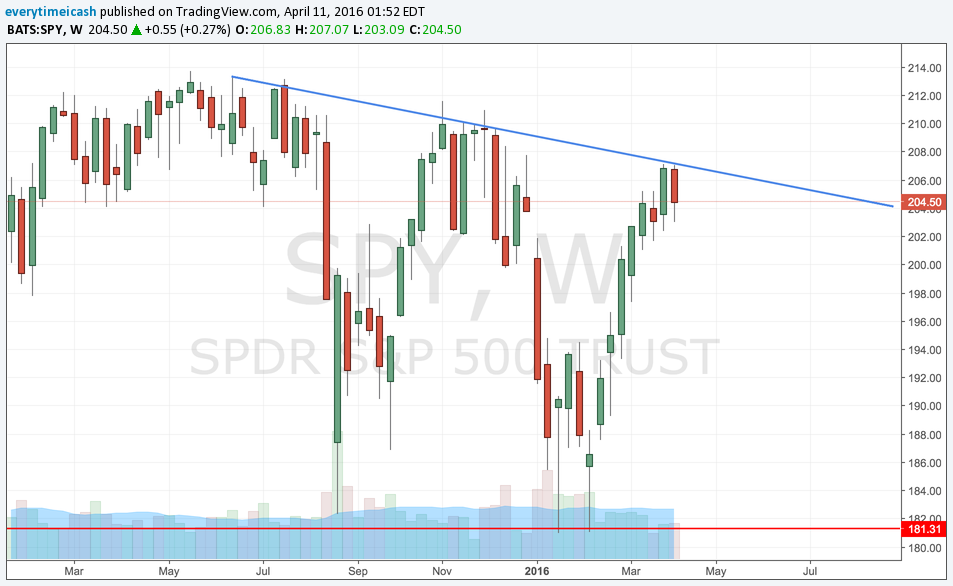
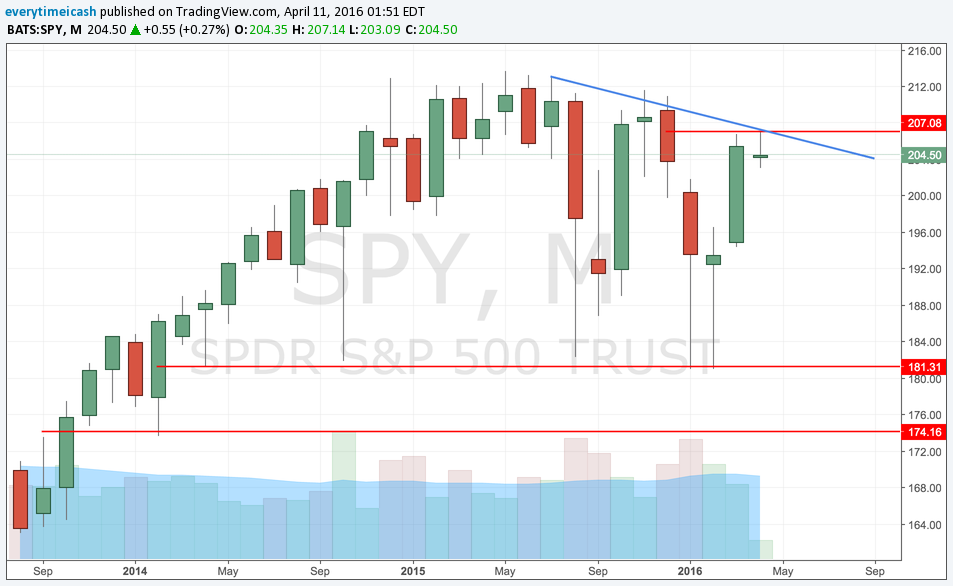
    Against "all odds" the SPY rallied back into its downtrend that it started back in 2014. As you can see in the charts, SPY has resistance on all time frames here. It is not bearish however and has support sitting at 207, 206, and the 20. "Line int he sand" remains 2025-2030ish. Recently, selling into strength has been the play. With earnings season around the corner, it is important not to overtrade and blow your wad before getting a chance to play the moves that will potentially yield better results. 

    With DOHA being the headline of the weekend, and with oil "tanking" at the moment, it will be the caution that you will hear about from all the pundits. Bias remains that the market is healthier underneath than it has been in quite some time and it's important to not trade the headlines and only focus on the price action. If you are confused sit back and wait. No need to trade in the slop.

    XLI & Components

    This has been one of the strongest components in the market as of late. Many of the issues here have been at/near highs. Many of these issues are going into resistance and "should" pause.

    UTX

    Resistance on the monthly and broke out on the other two time frames. The larger time frames are the ones that matter more. 

    MMM

    MMM into resistance.

    UNP

    Into downtrend resistance.

    CAT

    BA

    Into downtrend

    GE

    Earnings this week, will be interesting to see what they report/say.


    FIT

    Rounding bottom and broke out last week. Above 17.5 gets it going another 13%.


    BABA

    80 Trigger to be "safe"


    ADBE

    ADBE broke out on the daily but has not yet on the weekly.


    FCX

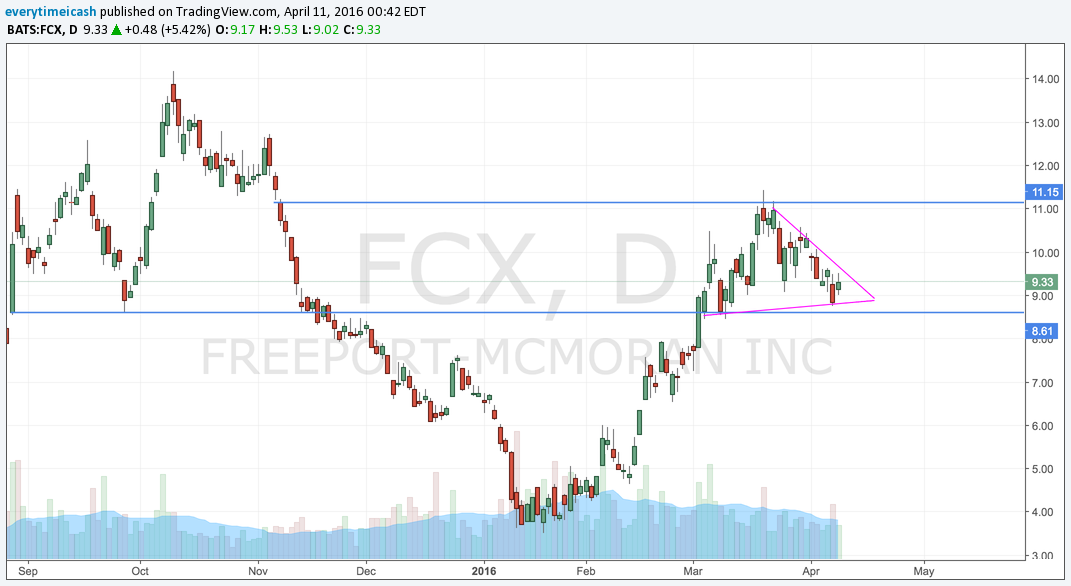
    FCX approaching a range breakout.


    XLU

    Money flow went into a chase for yield. Now we've got a potential H&S and we're facing resistance.


    TSLA

    People continue to bet against this name (foolishly). It has been consolidating and getting tighter. Levels above.


    CPS

    Nearing a weekly breakout.

    Gold in Black

    Gold in Black

    As expected, last week showed us a range bound week (inside week) following a 12% run up in the SPY. Action was quite volatile relative to the last few weeks with a couple of false breakouts and breakdowns. 

    SPY

    The SPY was range bound last week with 20 and 200MA functioning as support. As highlighted last week the 2030 level has functioned as support for the SPX and 2070 has been resistance. After last week's inside week we're going to pause for a break to the upside above 2070 or a breakdown below 2025. My bias is that a new wave of leadership is forming in the markets and that this rally in gold can propel for a while longer. That said, the SPX/SPY is in a downtrend since May of 2015 with lower highs. We will in fact see as earnings season kicks into high gear and the banks start to report.

    GLD GDX NUGT

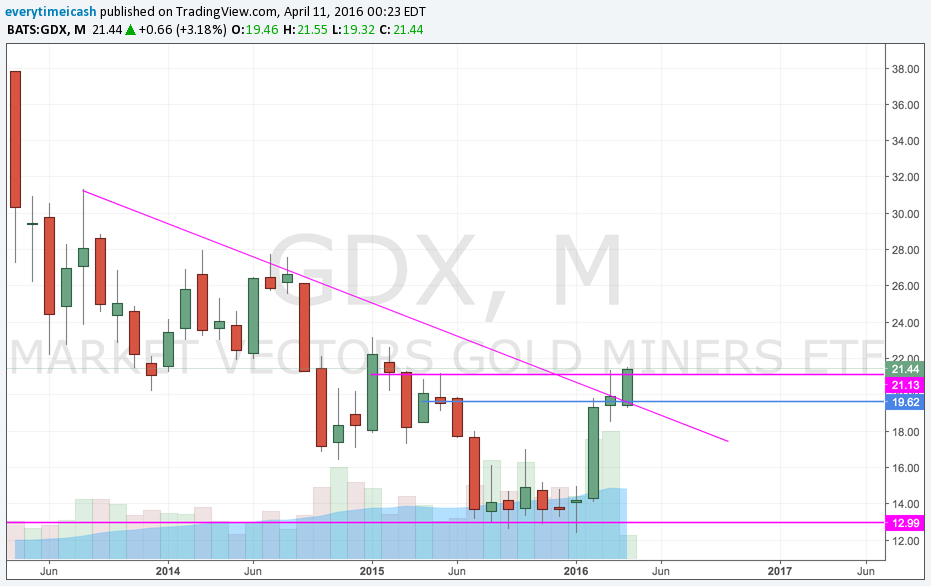
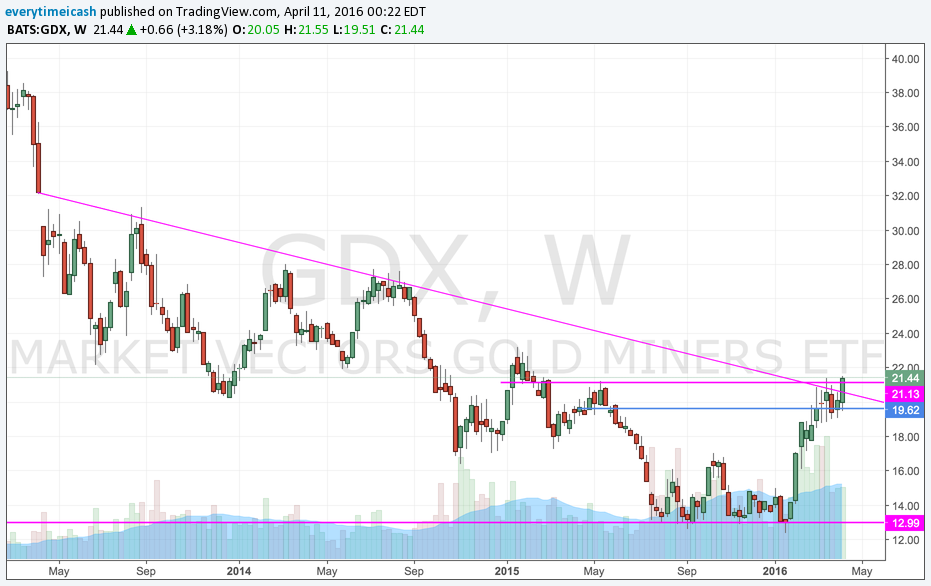
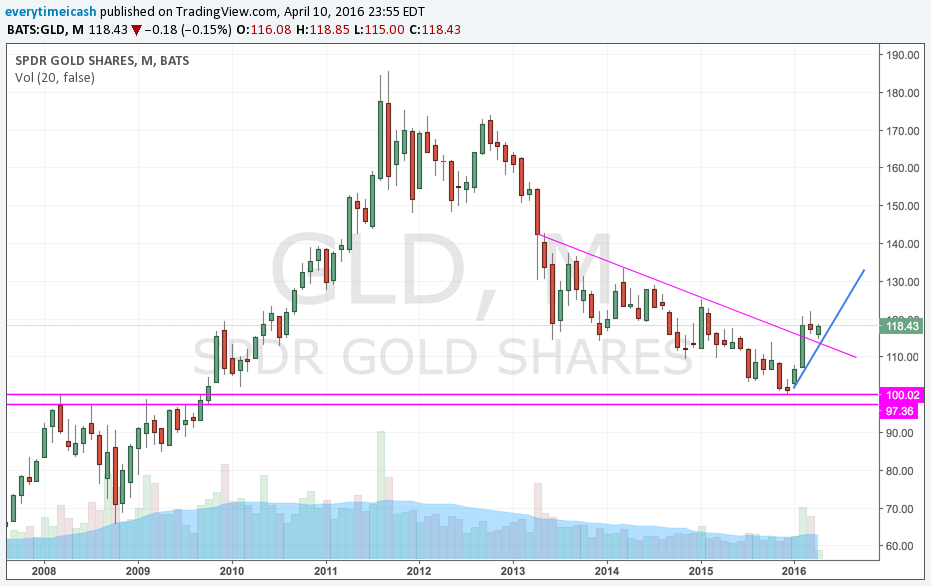
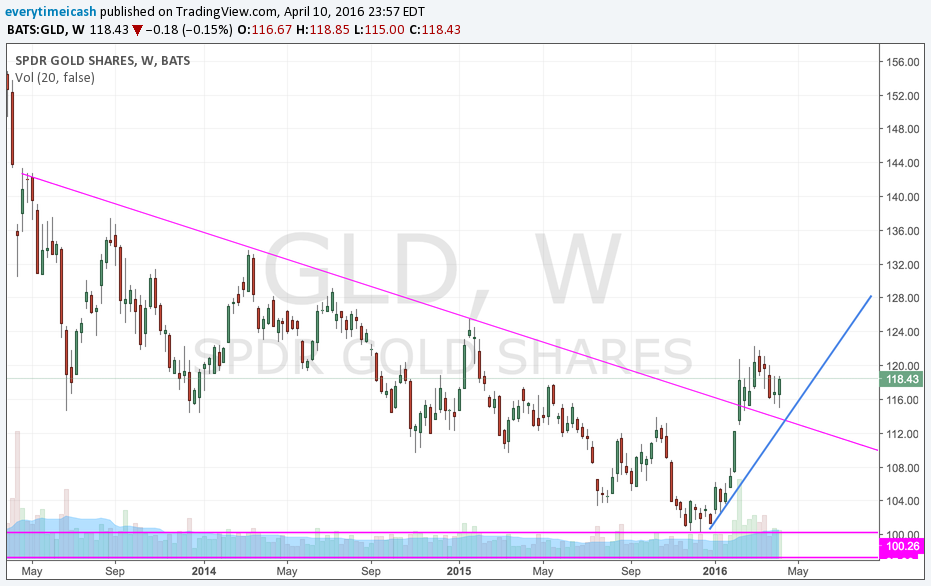
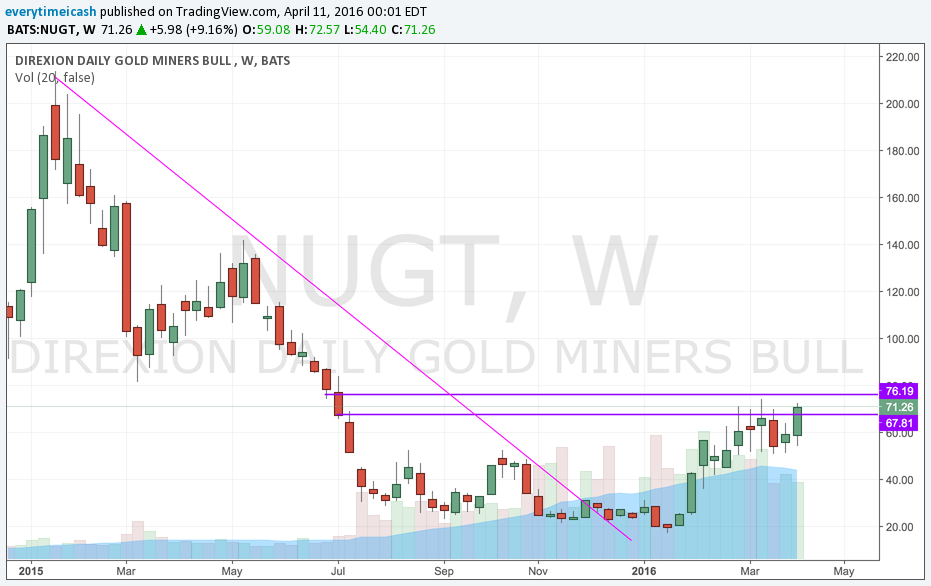
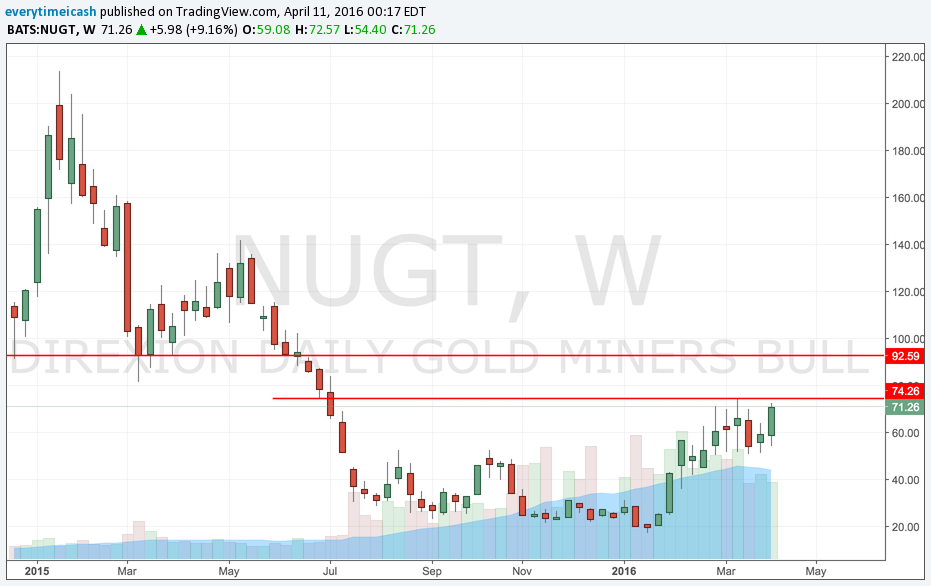
    As seen recently, gold has begun to break out as it broke its downtrend with a higher high and channel break. After a period of consolidation, it is apparent gold is ready to make its run again. As gold goes, so do its derivatives

    IBB

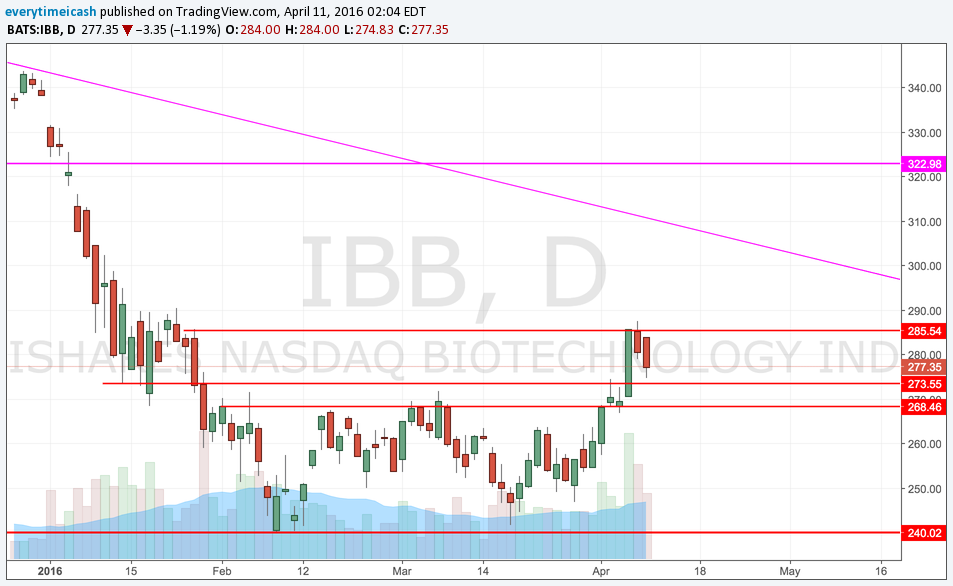
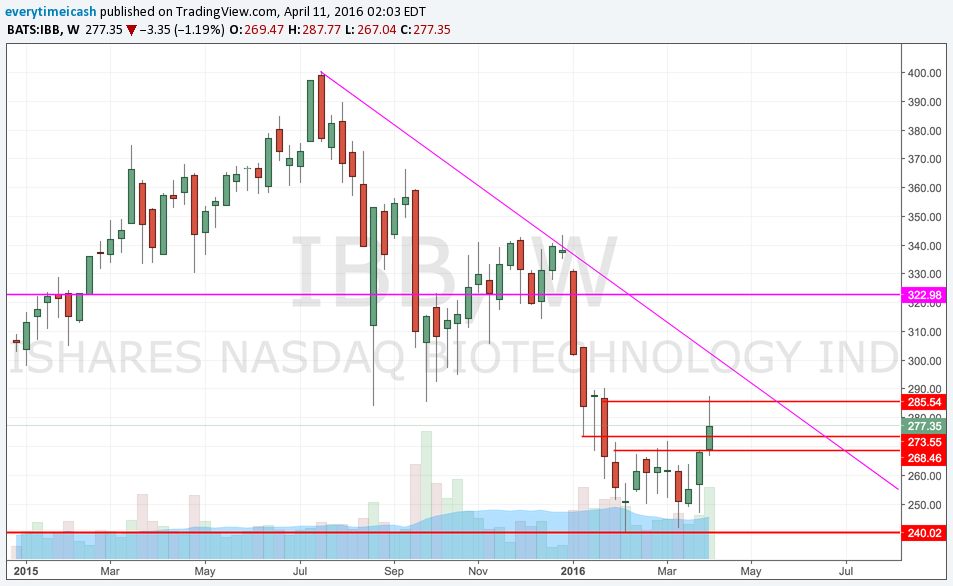
    As noted two weeks ago, the IBB bounced of its 50% retrace from the highs and has continued the run since. Our target of 285 was reached and we're now waiting for some consolidation before a potential run higher. A potential retrace to the downtrend is what we're potentially looking for.

    LUV

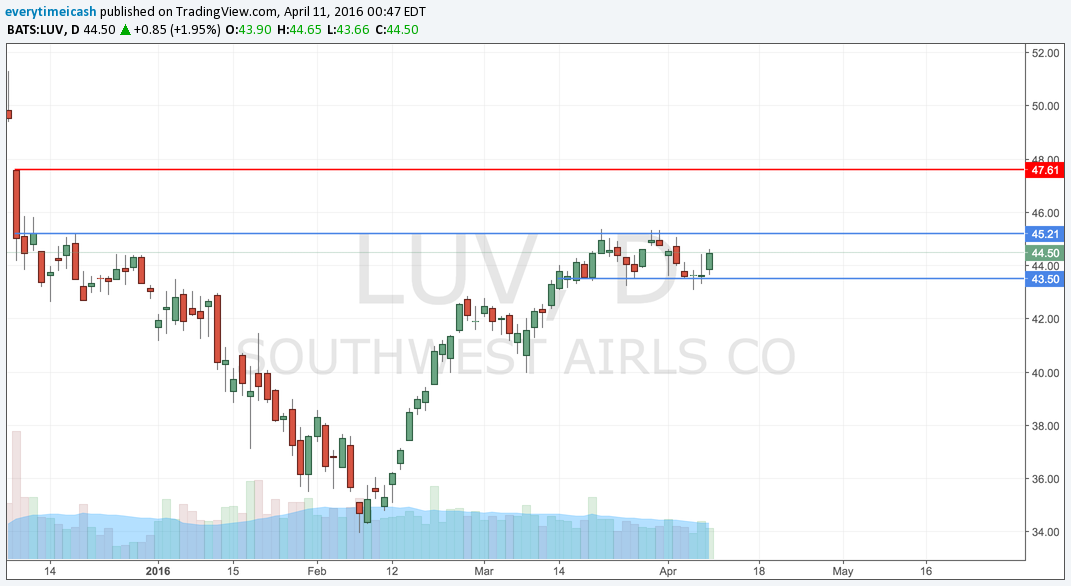
    Aggressive call buying into consolidation and this one is set to take off higher. 

    TSLA

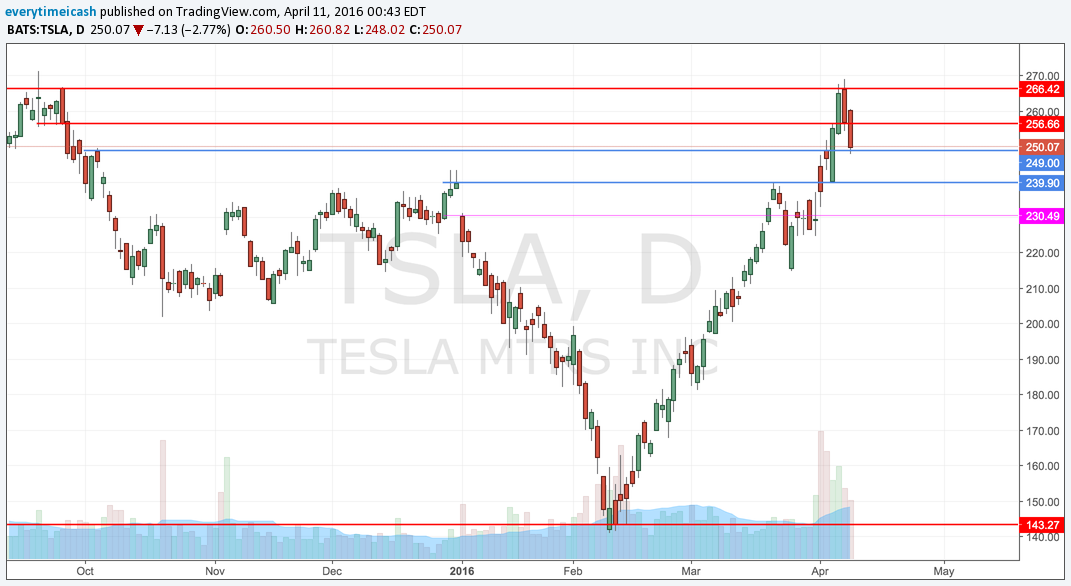
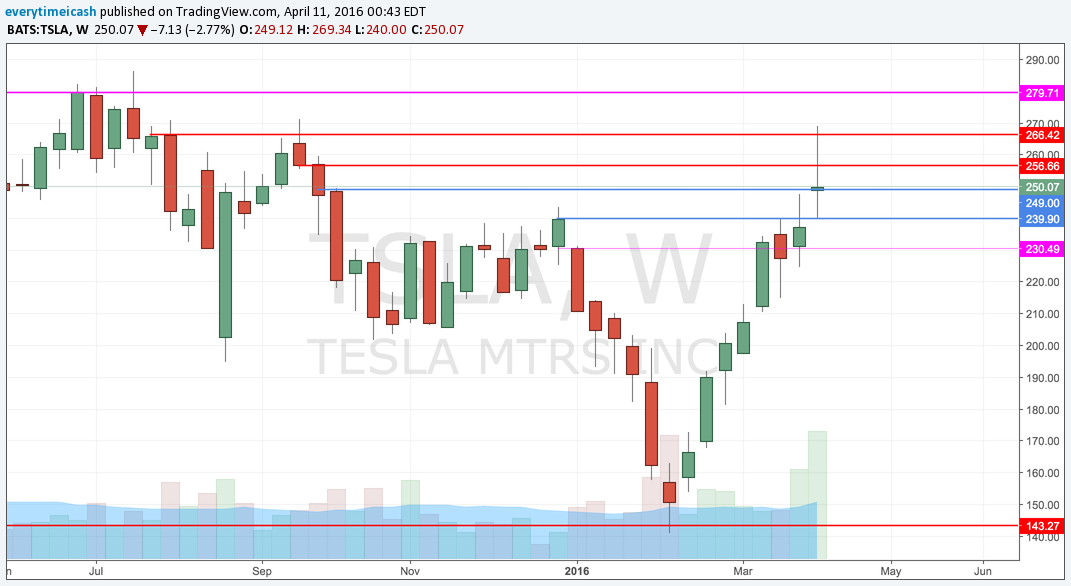
    After a torrid run up almost doubling its share price in approximately six weeks, TSLA finally hit resistance and started to turn lower. 

    AMZN

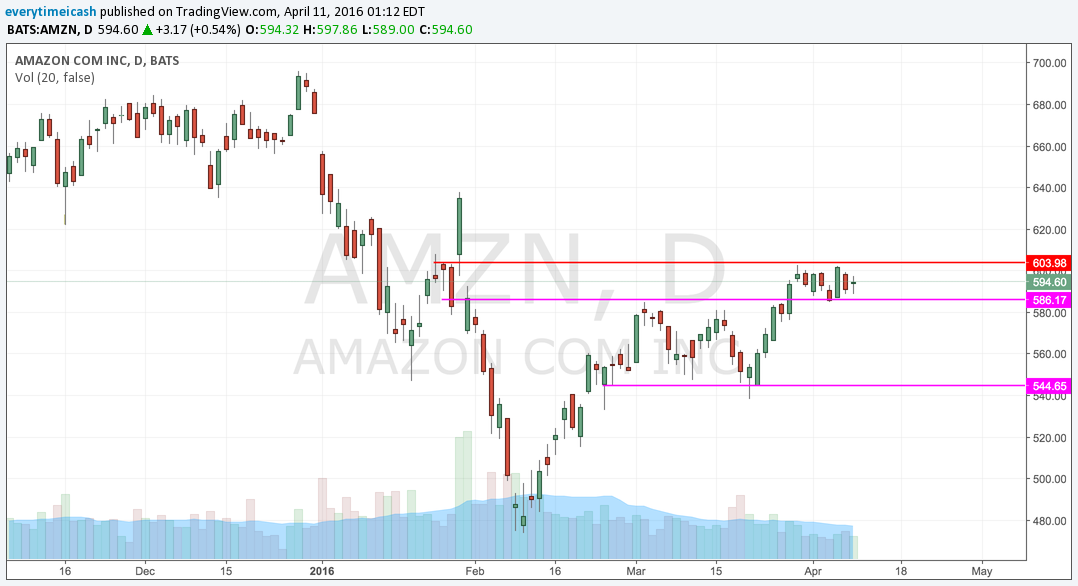
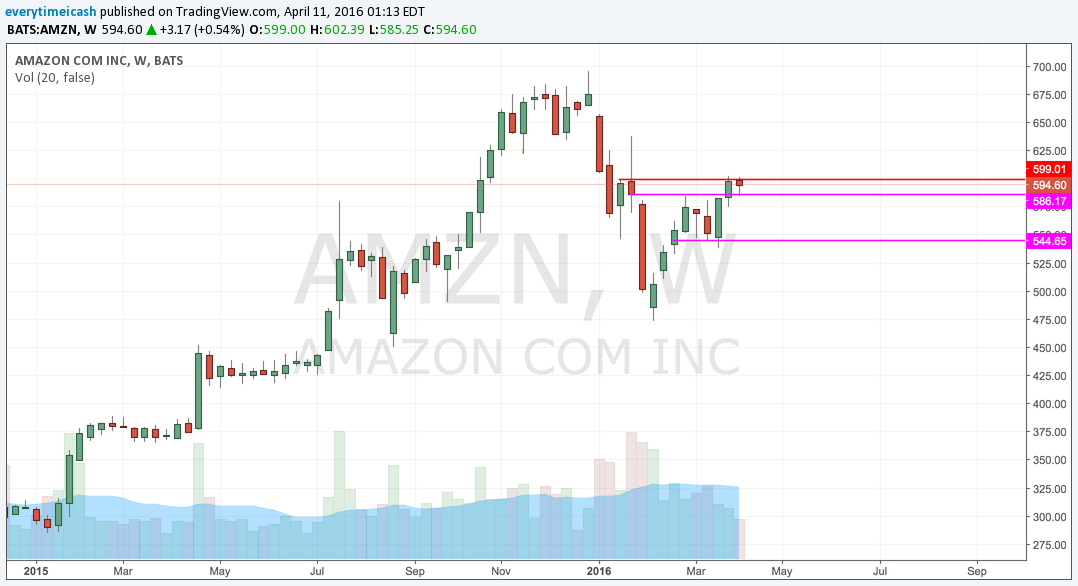
    After a face rip week, last week saw some consolidation. We're working with a flat 200MA and a breakout above 604 to spark this thing.

    XRT

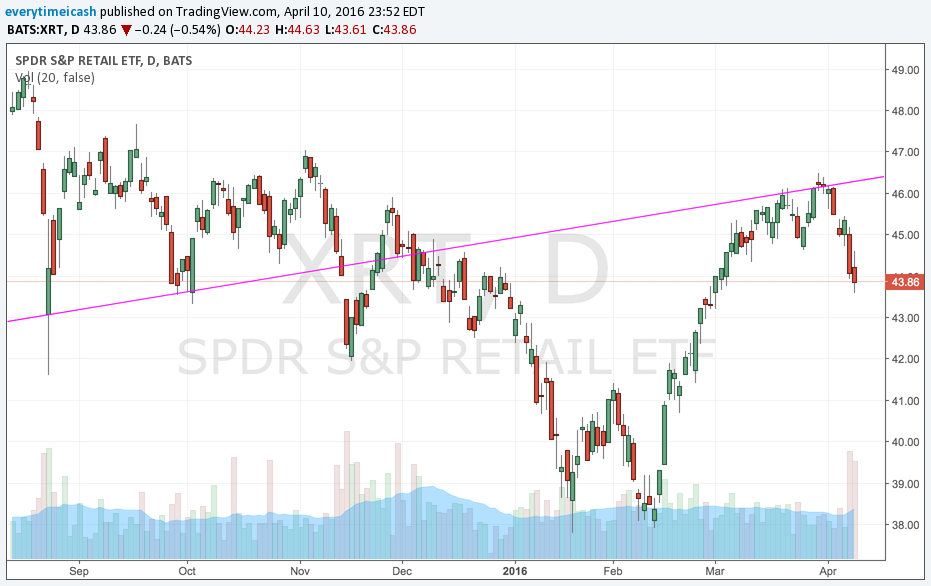
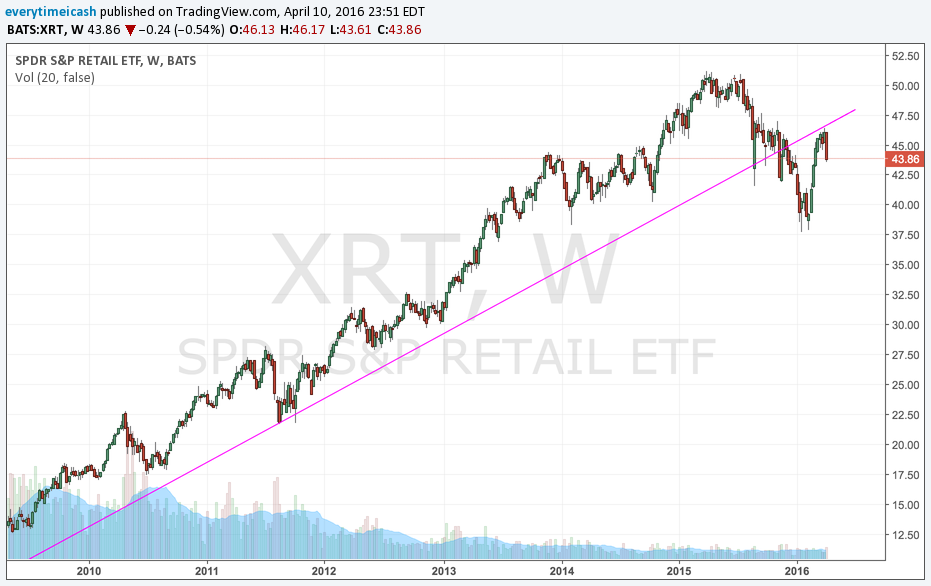
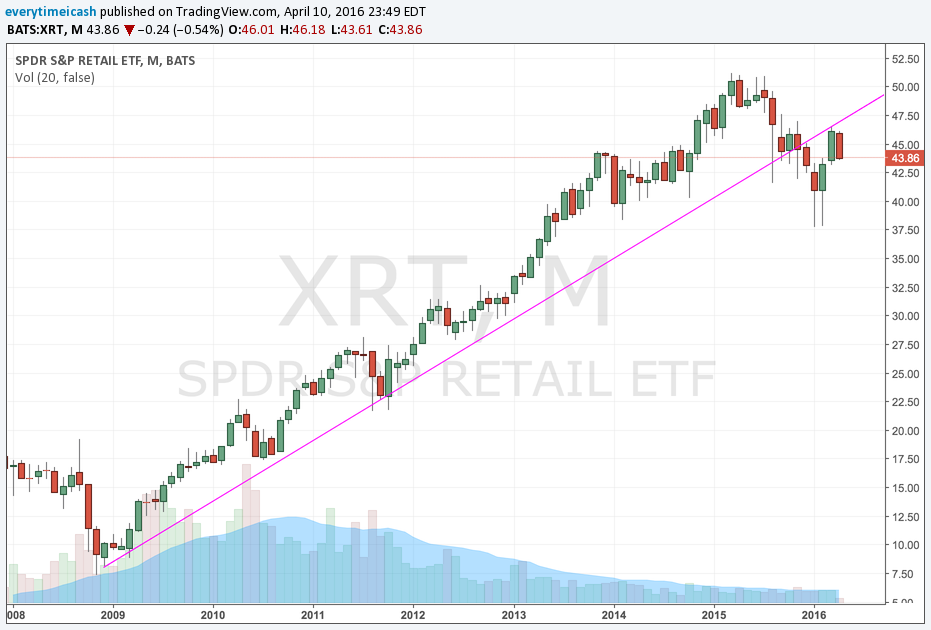
    After leading us on the way up, XRT has started to roll over as it hit resistance into its previous up trend. 

    CLF FCX

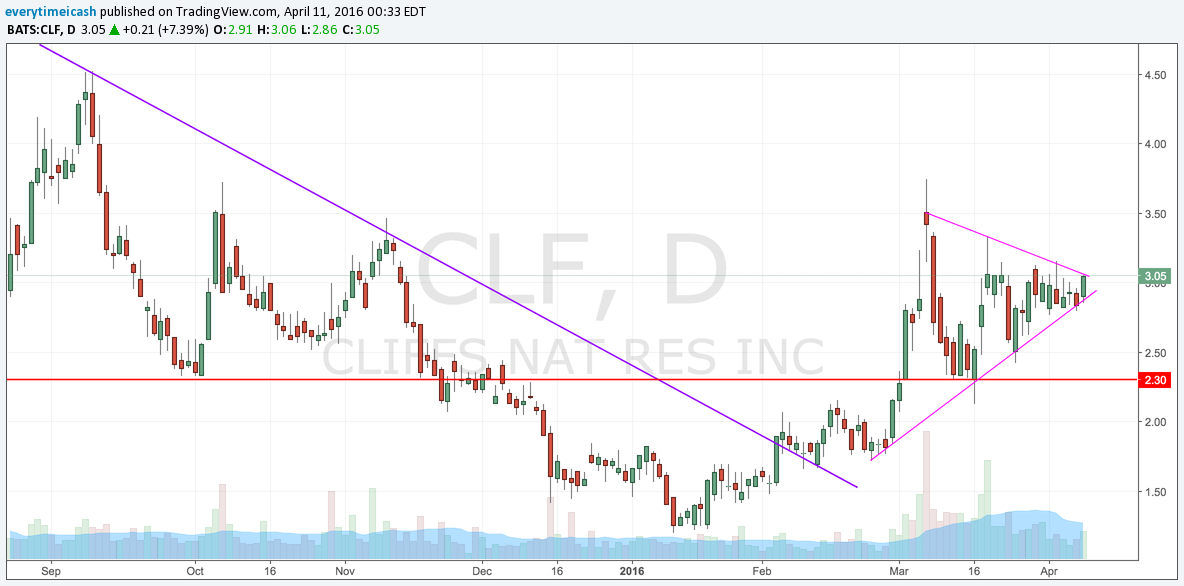
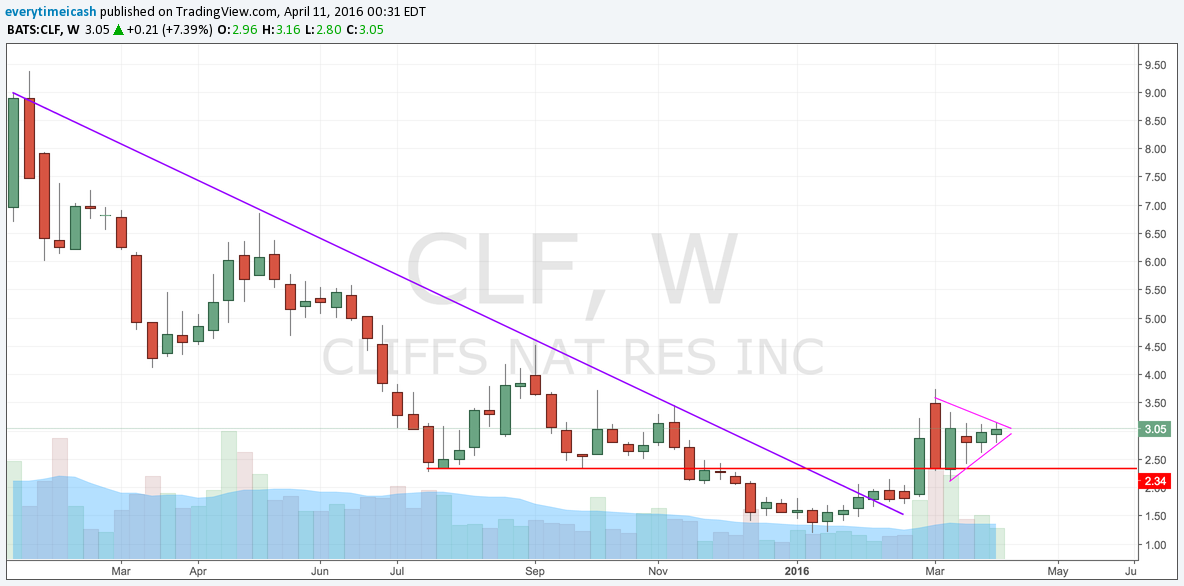
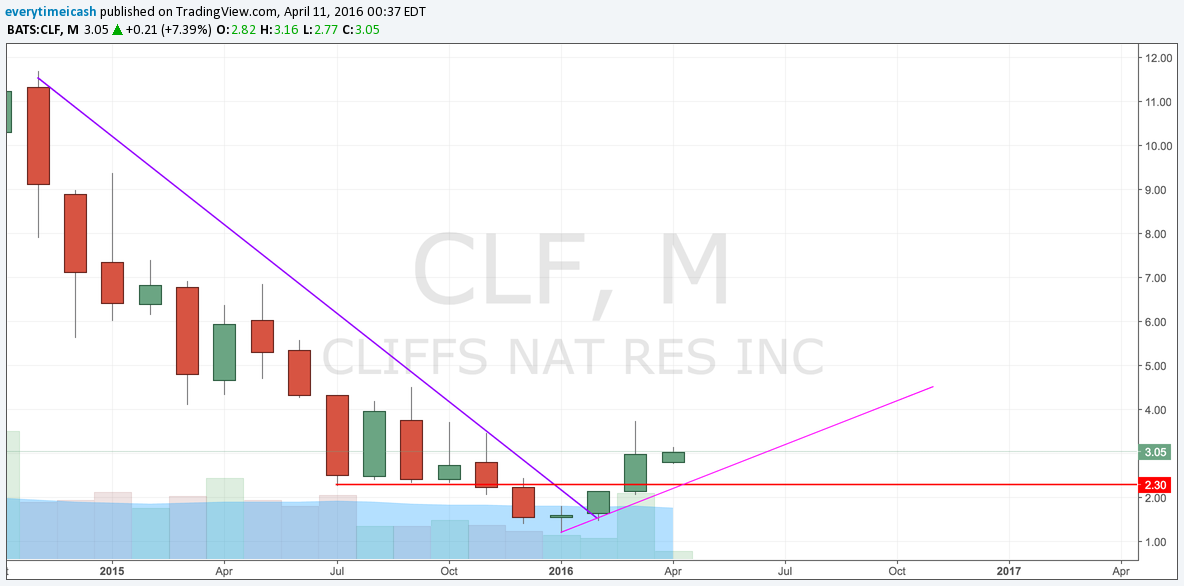
    Both in a flag and looking to break up or down. (Bias Up)

    WYNN

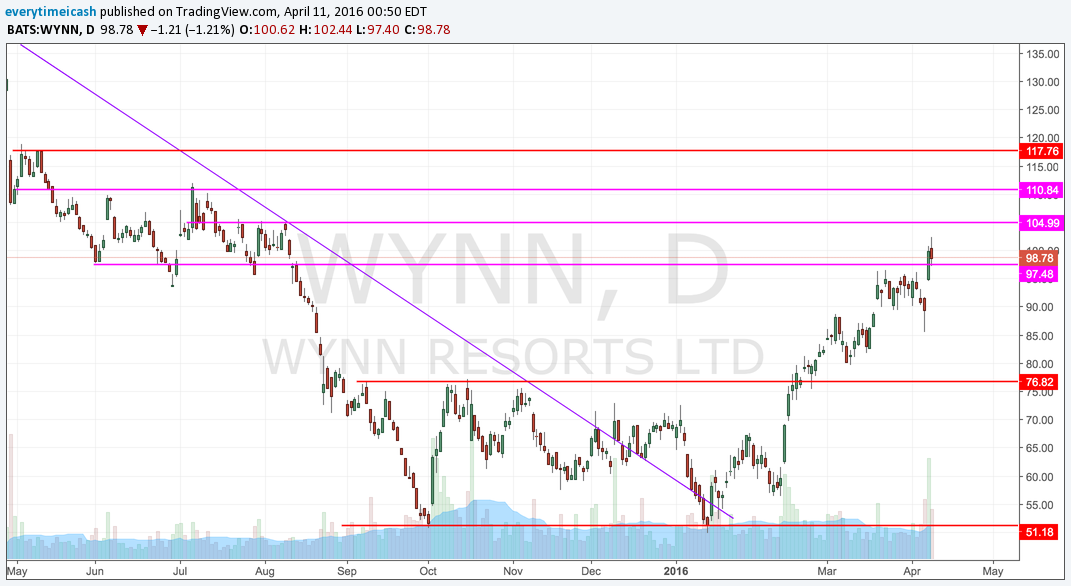
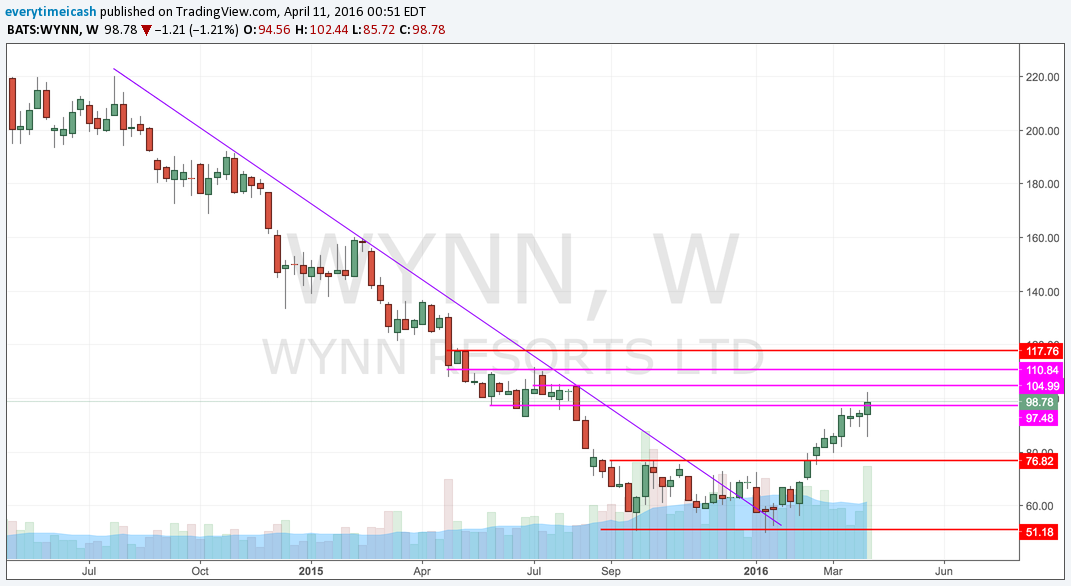
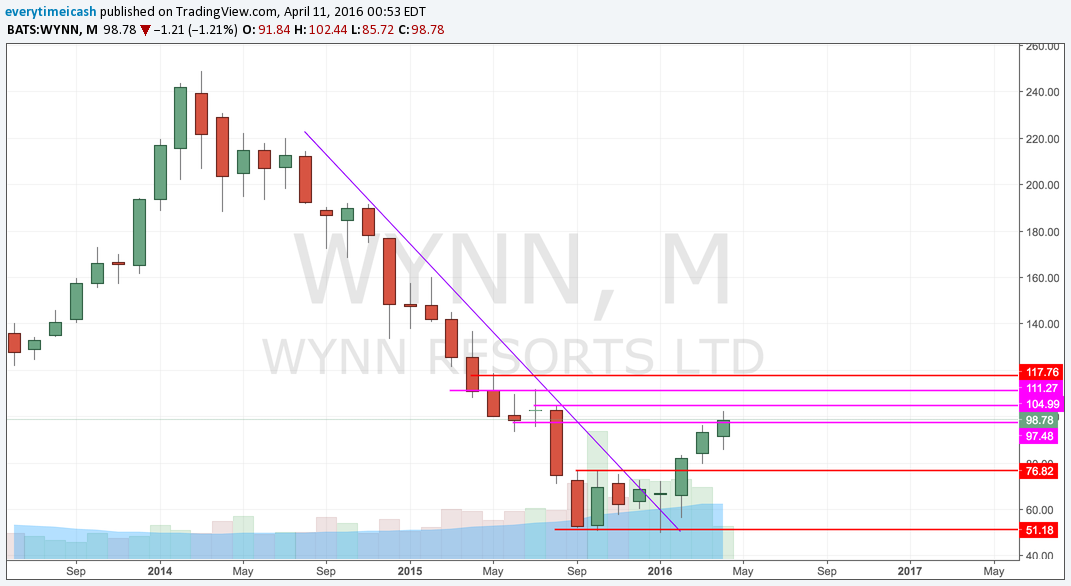
    Ignore the "Fast Money" stupidity by the guy who has a 17% stop. Stick with trend until it's broken. Currently 97.5 has functioned as support and below that is the box breakout support of 96. Last week we saw some continued May C buying by the wise guys.

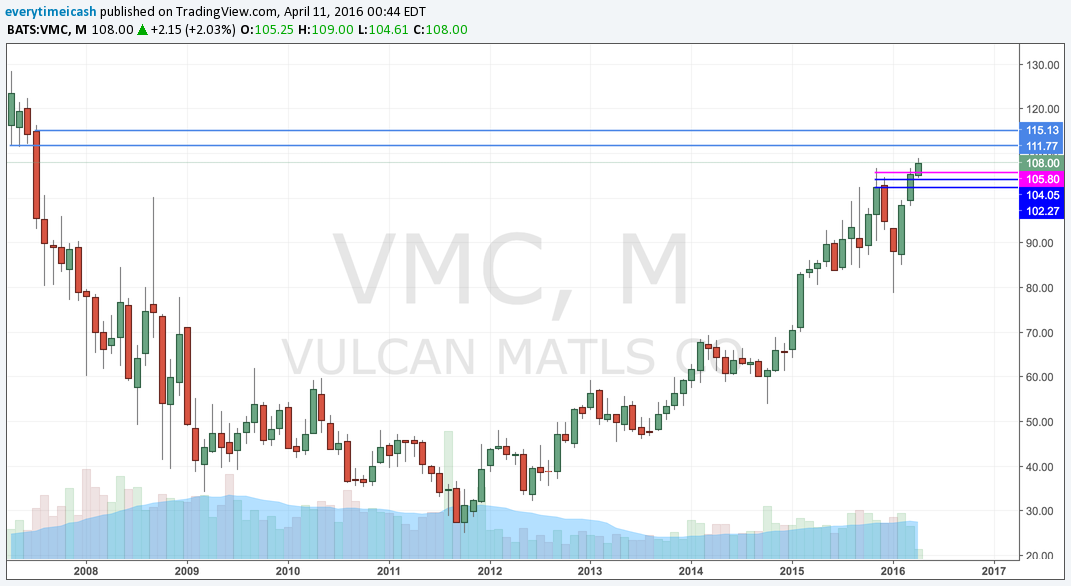
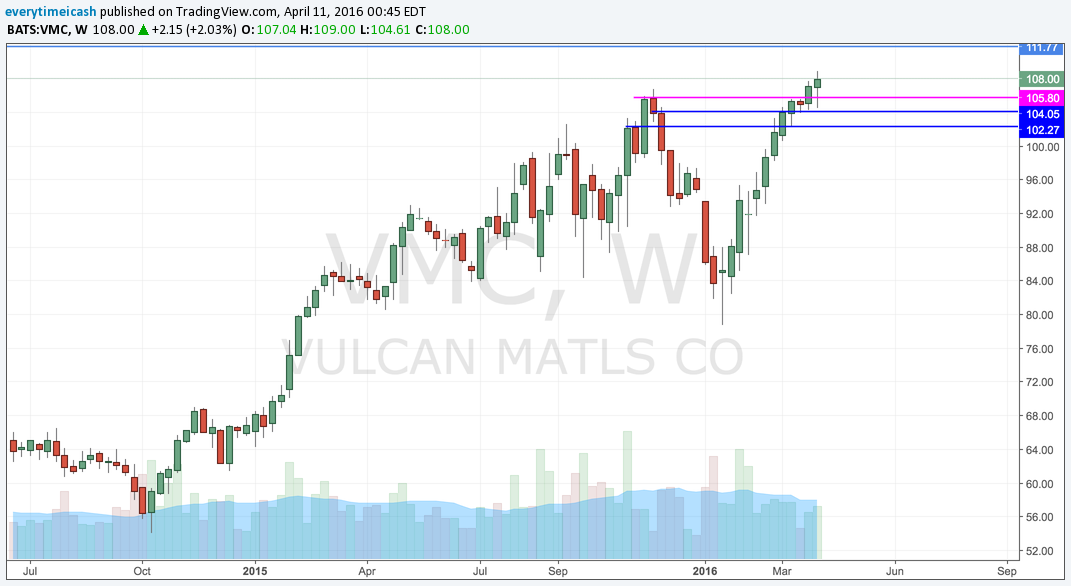
    VMC

    My favorite materials company out there. Period.

    China

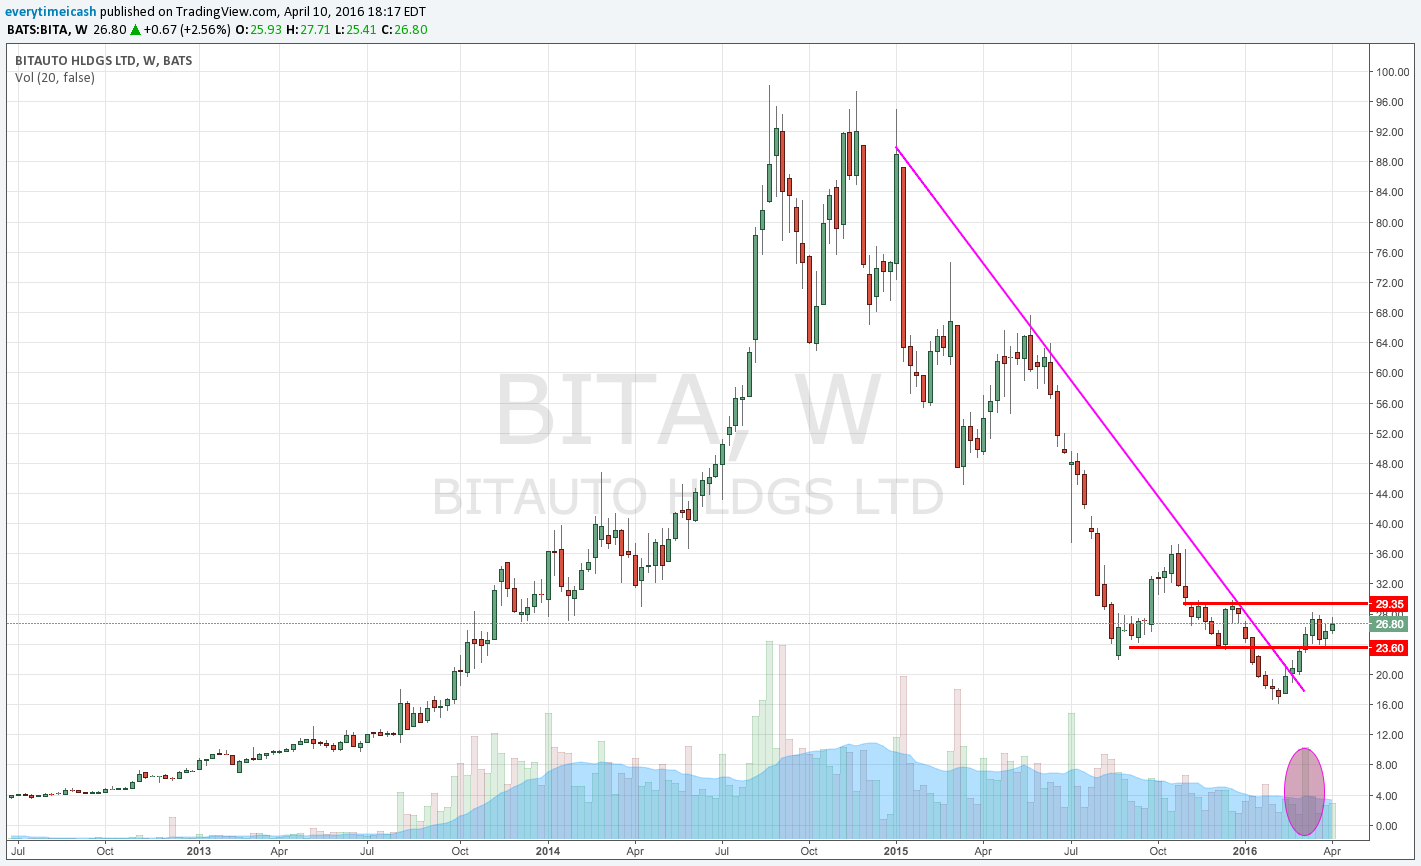
    Some China names have recently caught a bid and my favorite setup at the moment is potentially BITA. 

    This is a former high flyer with recent accumulation volume. 

    XOP

    This showed a break in 2014 and has been in a downtrend since. As of late however, it has showed some signs of stabilization in an attempt to get back to its down trend. 

    Basing for a potential break to the downtrend. 


    Under My Ambarella $AMBA

    Under My Ambarella $AMBA

    With 35% short interest, zero debt, 45% YoY growth, decoupling from GPRO chart, base building on multiple time frames, and a large institutional ownership group AMBA is a buy.

    April's Fools

    April's Fools

    The SPY continues to show resilience and defy the bearish thesis that has plagued those who have missed out on this recent rally for over a month and a half now. Last week SPY found support yet again off the 8/9EMA and thrusted upward to crete a new high on the year. As of now, "the trend is your friend." That trend remains upward for now as we've erased all our current year losses and the underlying market internals appear to represent a broader based rally. 

    Common upward themes remain as dip buyers step in at every sign of weakness and continue to press the pain upwards. Until this dip buying and the internals start to roll over the trend remains upward. Ignore the Dan Nathans and Brian Kellys of the world that continue to spew nonsensical caution. 


    WE ARE TRADERS WE ONLY CARE ABOUT THE TREND IN MOTION AND WE MUST REMAIN NIMBLE ENOUGH TO ADAPT OUR EGOS AND FOLLOW THE TREND AS IT MOVES


    SPY

    SPY broke out above resistance after consolidation. The above red line will function as resistance and the blue line is a downtrend the SPY formed starting August.

    Market has found a continuous bid by finding itself in a money rotation cycle from one sector to the next. It started with a short cover rally in energy and materials and has continued from sector to sector. Most recently, (last week) biotech and the FANGs found an underlying bid after several days of consolidation. 2030 SPX support will be our near term line in the sand. 


    GWPH

    GWPH has consolidated since it gapped higher and has held 70 support. Look for a breakout above the near term (purple) trend line and the larger (blue) line for a larger move.


    KATE

    Kate has been my largest swing position for weeks now and this is now "my main bitch." We're looking for a breakout above the resistance line as it has seemingly found dip buyers at every turn. The 13MA has been support. 

    KATE broke out above recent resistance. We have a convergence of trend line and a "cross up" forming. 


    AMZN

    AMZN Showing continued resilience on both the daily and weekly time frames. On the daily it is finding resistance against a flat 100MA. A breakout above gives first a target of 610 and then clear skies above to 630ish.


    XBI IBB

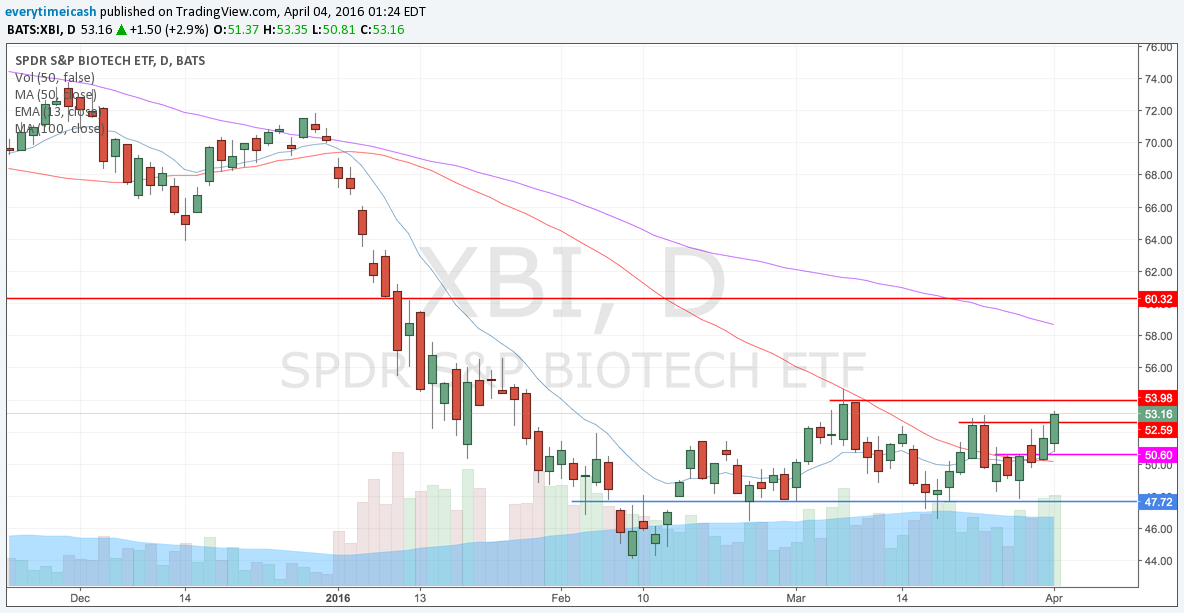
    Bios have been basing for quite some time now and showing signs of a bottoming formation. XBI poked its head out above initial resistance last week with sharp Call buying. IBB followed shortly thereafter. 

    Look for a continuation to 284 on IBB and 57-58 on XBI.


    AMBA

    AMBA pressed up against a downtrend that's still in tact. A break above the downtrend and this one will have legs.


    DG

    DG Breaks out of consolidation to all time high

    All time high breakout after long consolidation. 


    For market analysis, real time trades, and market insights.


    NDAQ

    NDAQ nearing a breaktout


    TSLA

    TSLA Failed but held previous "support"

    TSLA has been on a major tear and failed after the announcements Thursday night and Friday morning. Looking for consolidation. A breakout above 250 likely sends us for a 266 test. 275 looks like the trigger on the monthly.


    SQ

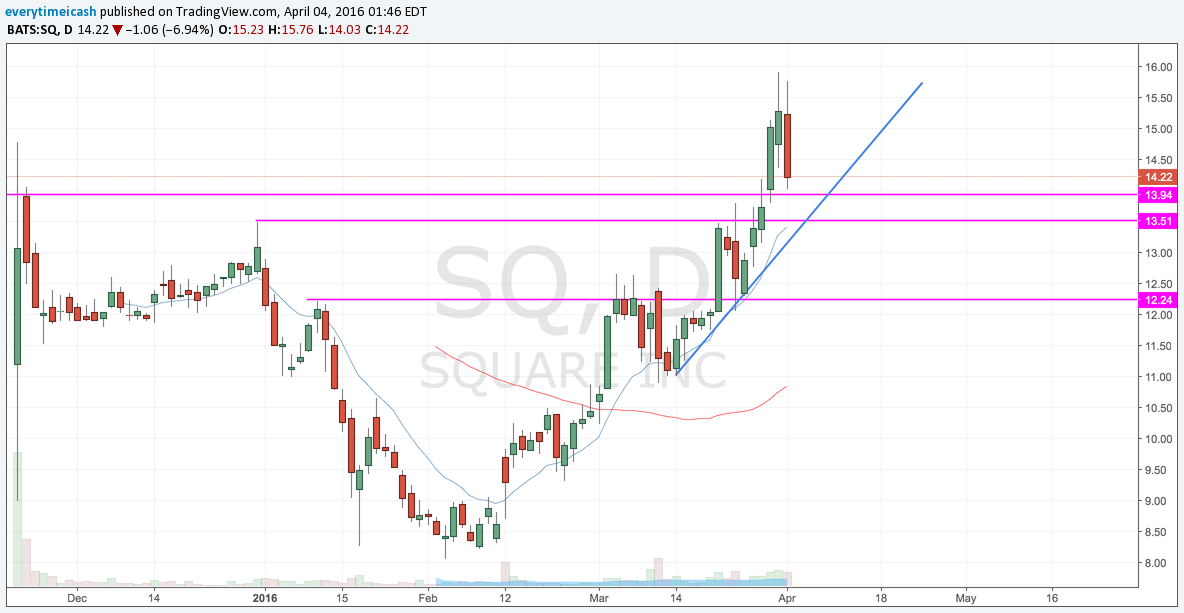
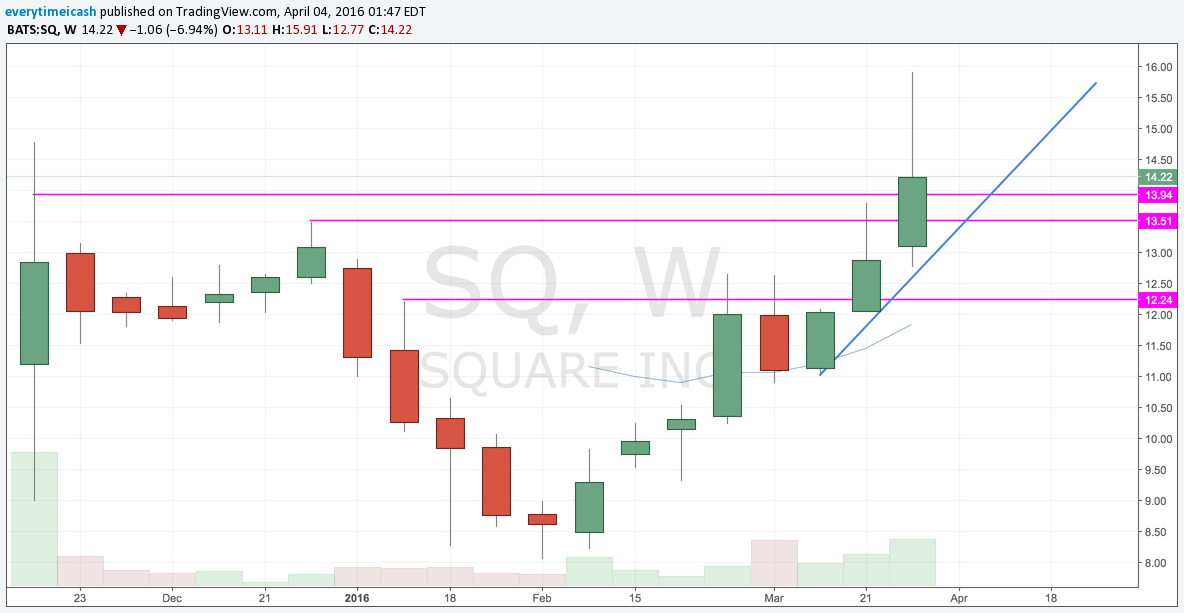
    SQ broke out of its IPO base last week and then quickly retreated back to the breakout point. Here are the trends. 


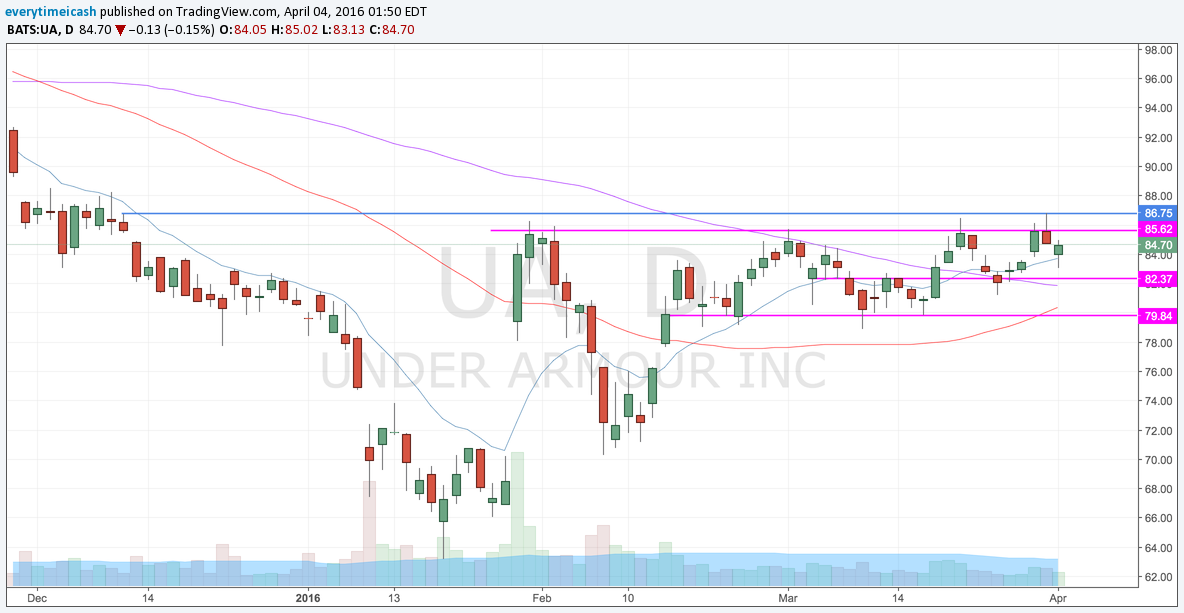
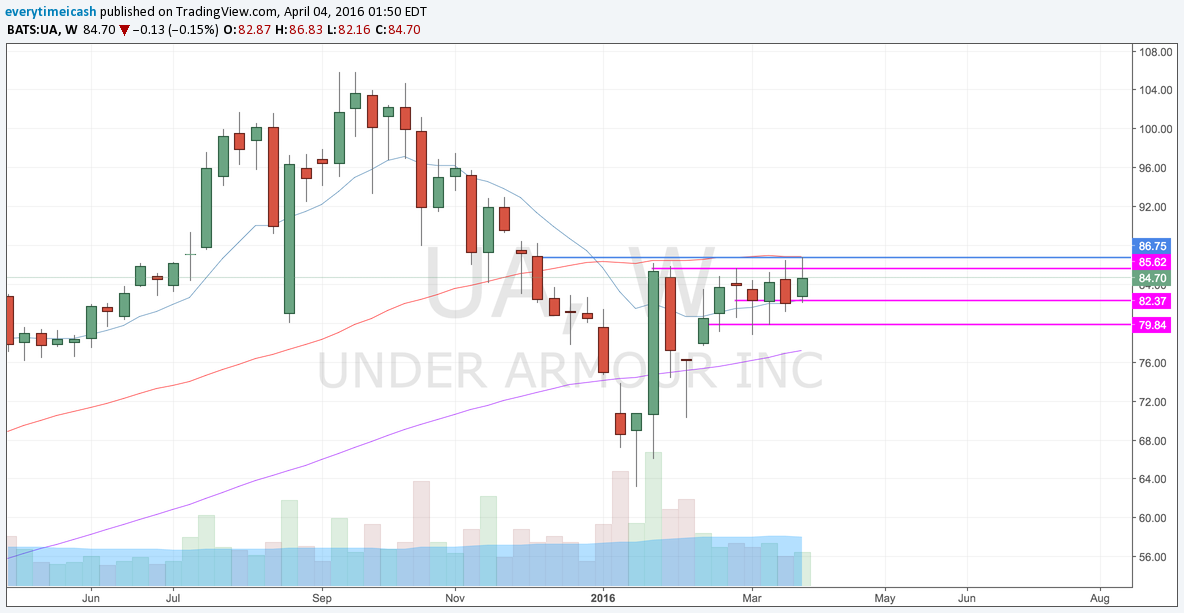
    UA

    Regressing Upward

    Regressing Upward

    Successful trading is always an emotional battle for the speculator, not an intelligent battle...A man must know himself thoroughly if he is going to make a good job out of trading.
    — Jesse Livermore

    Regression is Mean


    IF you've ever taken a statistics course you have certainly heard the term "Regression to the Mean" (RTM). If you were drunk and/or tired in class, or simply never took a stats class and don't know what I'm talking about let me give you a quick definition. 

    Regression to the Mean: Stats phenomenon that says the greater an event deviates from its average, the more likely that the next instance of that event will deviate less far. 

    In simpleton terms: When shit gets extreme, the next time that shit happens it's more likely for that shit to be less extreme.

    Let's see what that shit looks like:

    Regression to the Mean (RTM) 

    Looking at the picture above you get a clear demonstrated example of how RTM works. Sometimes things deviate to the mean to the upside and sometimes down. However, they seem to travel along a defined trend line. Applied, you can make this case for every stock that has ever traded in the history of stocks. 

    Understanding this phenomenon will help you infinitely with your trading ability. If you apply this theory to your trading you will see that it consistently holds true. Every individual has an average trading baseline that he/she trades along. Sometimes the curve goes in your favor, sometimes it does not. If you've developed a system however, you will find that over the course of the long run you will revert back to your average baseline. 


    🔥I'm "HOT" 🔥


    Do you feel like you're on a hot streak? Slap yourself. You're not. I know, I sound like a douche saying that. It's true though. It also works the opposite ways. Sometimes we fall into "hot patches" where we basically can't miss in the stock market. Sometimes the opposite happens. Thats why it's very important to remain level headed when you trade. You must maintain the poise necessary to move forward regardless of momentary outcome. 

    There will be hot streaks and there will be cold ones. In order to maintain success in this business you've got to learn to temper your expectations and stick to your rules. Don't adapt the rules for the circumstance. If something's not working, evaluate whether or not you're adhering to your rules. Don't look for the change in them. Look internally and realize whether or not you are actually holding yourself to that standard. 


    Numbers Game, My Man


    If you can learn anything from the definition or the write up above its simply that the more you try the more likely you are to bring down your average. Like a basketball player, the more shots you take the more likely it is you will not be perfect. So one of two things should be done:

    1. Get more selective with the shots you take
    2. Work on your shot and be a better shooter overall so that your average is higher (study)

    Let's put this in perspective. 


    The market typically chops 70% of the time and gives direction 20-30% of the time. So in theory you have a couple of choices, outperform the market 70%+ of the time or mostly trade during the times in which the market is trending. 

    Mathematically it works like this: 

    If you only traded 30% of the time and had an overall outcome of a +24% account value (this example assumes you're trading options) during those times you would compound a $3000.00 to over $58,000 in less than a year.

    Furthermore, you would double your account by just the 3rd trading day.

    The above assumes that you are disciplined to not trade while the market is chopping around and assumes that you are equipped to know when the markets don't chop. Obviously the results won't be linear but the example is to show you a simple proof of concept;

    Trade fewer days and only setups that look to be working and you will enhance your chances of success. The more you trade, the more likely you are to fall into being AVERAGE.


    Compounding


    For fun I want to show you the power of compounding and keeping your risk small. Below is an example of how fast you can compound an account over the course of 50 years with no additional contributions. 


    On a more conservative track, averaging a 12% compounded rate annually will take $3,000.00 to over $1,000,000 in 50 years. This calculation assumes no addition contributions are made. 

    1 : 3380.47
     2 : 3809.2
     3 : 4292.3
     4 : 4836.67
     5 : 5450.09
     6 : 6141.29
     7 : 6920.16
     8 : 7797.81
     9 : 8786.77
    10 : 9901.16
    11 : 11156.87
    12 : 12571.84
    13 : 14166.27
    14 : 15962.9
    15 : 17987.4
    16 : 20268.65
    17 : 22839.23
    18 : 25735.81
    19 : 28999.76
    20 : 32677.66
    21 : 36822
    22 : 41491.95
    23 : 46754.17
    24 : 52683.77
    25 : 59365.39
    26 : 66894.41
    27 : 75378.3
    28 : 84938.15
    29 : 95710.44
    30 : 107848.92
    31 : 121526.86
    32 : 136939.51
    33 : 154306.87
    34 : 173876.84
    35 : 195928.78
    36 : 220777.45
    37 : 248777.56
    38 : 280328.78
    39 : 315881.49
    40 : 355943.17
    41 : 401085.67
    42 : 451953.38
    43 : 509272.38
    44 : 573860.86
    45 : 646640.79
    46 : 728651.02
    47 : 821062.21
    48 : 925193.45
    49 : 1042531.14
    50 : 1174750.19

    The Humbling Truth

    The Humbling Truth

    Success in investing doesn’t correlate with I.Q. once you’re above the level of 25. Once you have ordinary intelligence, what you need is the temperament to control the urges that get other people into trouble in investing.
    — Jesse Livermore

    I am certain that many of you who have come across my online profile have come to the belief that I am/was full of shit at one point or another. If you haven't I admire your naiveté and thank you for your trust. Though I've encountered what most would quantify/qualify as "success" when it comes to trading and though I've been fortunate to never come on the negative end of the stick, this does not mean that I've never faced pitfalls. This also doesn't mean that I haven't faced my own level of disappointment and frustration. Most importantly, it doesn't mean, and for lack of a better term, the market hasn't made me her bitch from time to time. 

    The longer you stay at the trading game, the more you will be humbled. I liken the market to a game. You start at a particular level in this game. Some have a cheat code (more capital) some have to begin at the very beginning with very limited resources. Fortunately however, whether you're insanely wealthy or only have a couple hundred dollars to your name there are always opportunities.

    Personally, I've been on both sides of the equation. I've seen a $200 trade blossom into $21,000+ in a matter of an hour. I've also had the misfortune of watching $9,000 evaporate into thin air on a bogus rumor. Both feelings, though unique on their own, are rooted one in the same. Euphoria and anger both different sides of the same coin. I'm going to share the most valuable lesson I've ever experienced as a trader; even though I didn't know it at the time.   


    The Loss


    I'm not sure why you trade but I'm almost certain for most of you it's to earn income/make money. At least that's why I got back into trading. The ironic part is in order to make money, you gotta learn how to lose it. Sounds "bass aackwards" i know, but it's not. What I mean is you've gotta learn how to trade good setups. Setups that work in your favor. You've got to learn to know when to say "I quit" and tap out of these setups too. Without a plan or without defining a trade you'll simply compound your losses and wind up worse off than you were. 

    Like I said above, I've been lucky to stay ahead of the 8 ball during my career. But I've faced my fair share of set backs.

    Below, I'm going to share with you the largest set back I've ever encountered and the lesson it taught me. 

    In late 2013 I discovered the power of leveraging weekly options into a trending stock. Previously I'd only traded commons or monthly options. Initially, I discovered this power with three very volatile stocks -- FEYE TWTR & TSLA.

    More specifically, I was able to capitalize on riding TWTR for every one of its breakouts to fresh highs and compound my account quite rapidly. "Feeling like I was on a hot streak" I started to push my luck with TSLA. I attempted to replicate my process with TWTR in TSLA as it made a new high seemingly every single day. I continued to take on risk and leverage my positions for further upside gains. I was aggressive and continued to press my luck. 

    In early January 2014 I learned the most important lesson of my trading career. Don't fight the trend, and never average down a weekly losing position. As you can see from the chart below (one I've shared on multiple occasion) I learned (though didn't know that at the time) the hard way, that averaging down on losing positions will destroy you.

    What that above chart doesn't express numerically is that I was able to 7x my account from the start of November simply by staying with the breakout trend and backing off when it failed. On the week of January 9th, while "expecting" TSLA to break out and continue higher after a "brief pause" I made the bullshit move of "averaging down my cost" thinking that I wouldn't need much of a move to get me going. What I failed to realize was that TSLA stalled against a major trend line and at a gap resistance and it subsequently was going to back test its previous breakout level. I was stubborn and it cost me. That mistake erased over a month and a half's worth of work, patience, and more importantly, gains

    My account went from 7x to a meager 2.5x.


    COGNITIVE TUNNELING 


    Cognitive tunneling is a phenomenon in which a a psychological lack of attention takes hold without obstructing  your individual vision. This phenomenon occurs and is defined as an event in which an individual can't see what's in front of them because of an unexpected circumstance. Specific examples of this occurs when people are so focused on one particular action that they fail to see the greater picture and subsequently cause damage to themselves as a result. 

    An example of this is a quarterback that is so fixated on threading a pass to a receiver that he completely misses the safety that's cheating underneath. 

    This effect is just how dangerous the markets can get. Sometimes, we get so fixated on a particular instance or result that we fail to see what's going on around us. In the above example, I was so concerned with my own personal position in TSLA that I neglected to see the bigger picture; TSLA rejected the gap and was failing. Though the following week was a tough one (especially since the following week TSLA broke above the previous failed breakout level and continued on to make new highs) it was a pivotal one in my trading career. 

    It was a stern reminder to never average down a losing position and to set a stop and respect it. It was also a reminder that I/we are never smarter than the overall group. That momentary pain, though brutal, turned out to be the most important lesson that I've ever learned. 


    Second Life


    The most important lesson I received the week of Jan 9th was that capital preservation is the key to success in the market. Leverage only what you're willing to lose, and stay humble with the idea that you may in fact be wrong. Doing so will only allow you an opportunity to add another life to your trading career.

    If you only take one thing away from this post please let it be this; set a max risk tolerance on every trade and respect it. Don't average your losers and don't assume you know more than the crowd.  

    The Problem With Consistency

    Comment

    The Problem With Consistency

    I had made a mistake. But where? I was bearish in a bear market. That was wise. I had sold stock short. That was proper. I had sold them too soon. That was costly. My position was right but my play was wrong.
    — Jesse Livermore

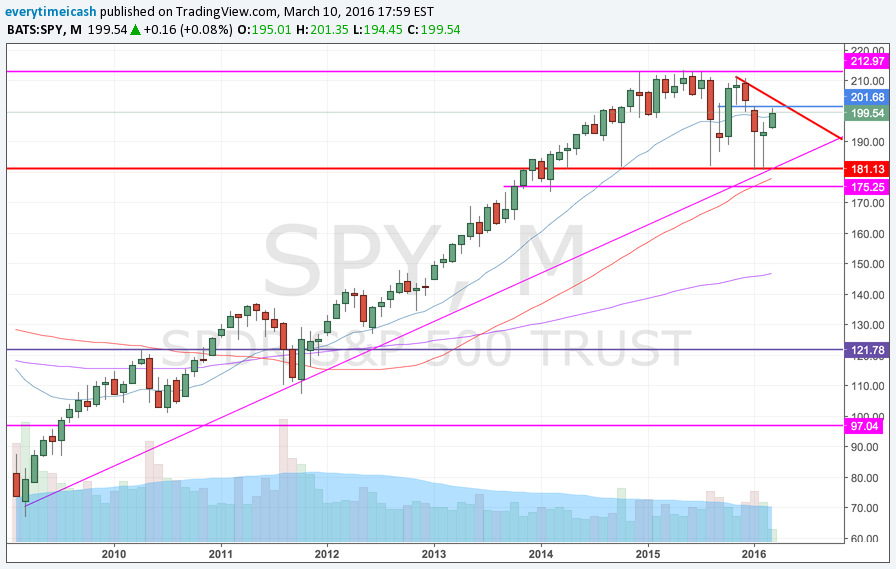
    As I write this, the markets have swung from 201 to 197.5ish back to 199 in the SPY. The swings have been wild and back and forth. Bulls will argue that the economy isn't as bad as people are making it out to be and central bankers are on your side (Super Mario). Bears will argue that we've come too far too fast and we're setting up for a violent failure, market breadth is dampened, and leaders/momentum is rolling over. 


    SO WHO IS RIGHT?


    Well, and I mean this without it being a cop out, both parties are correct in their assessments. We're in a position now in the markets where our accustomed leadership is waining (think #FANG)  and the bears have seemingly lost control in the last several weeks. This sets up for one of two possible scenarios; 

    1. The bulls have regained control as we've tested the last trend and are back to resume an upward thrust
    2. This is the last stage grand hoorah before we obliterate everything in a cataclysmic ending

    Well, technically there are three scenarios. But the third scenario is one that will yield back to the first two;

    • We chop around in a range until the bulls or bears reclaim complete control and we continue in a directional path. 

    For people like us, this means we're left with limited options. The times of buy and hold are likely over -- at least until further notice. We've got a flat 100MA, 50WK MA 100Wk MA and 200DMA overhead. A literal tug of war between the bear and bull camps. Positions that have been on for years are starting to unwind (#FANG distributed and short covering in depressed energy assets). The moves are subsequently violent as those who look to get out are getting out and those who are finding "value" are getting in for "the next leg" whatever that means. 


    PERSPECTIVES


    First of all, ignore all the bullshit you read/hear. It doesn't fucking matter. Having an opinion doesn't fucking matter. The only thing that matters is price. 


    As we see above, the SPY longer term monthly trend remained in tact with its most recent test of 1800. This case emboldens the bulls to make the argument that we are still in trend and we have corrected. Furthermore if you look below, you'll see a chart of previous bull market bursts and their respective PE ratios at the peak. In this market we have been trading between 16-18x for quite some time now and the overwhelming euphoric conditions have simply not been there. 

    SPY PE Expansion in Bull Markets

    Markets like this are designed for those who are "professional" in demeanor and nature. Point your attention to the figure below to understand how markets like these (when/if healthy) will and do work. 

    As you can see from the figure above markets suck in both buyers and sellers at max pain points 

    Though the above illustrates a bullish outcome, the reverse is also very true. In many cases issues resolve to the downside. When that happens, market declines typically precipitate and escalate more violently than the upswings. With the bull market top currently closer than the recent lows, it's difficult from a risk reward perspective to buy the top expecting higher. Thus is the bear case. In addition, economic outlooks don't give an optimistic view. 

    In addition, we've seen earnings decelerate for more than a year now. Earnings beats are coming more and more from operational efficiency than revenue growth. That means businesses are getting leaner to beat expectations and not growing as fast. This deceleration in growth is troublesome because at some point companies need to continue to grow as there is only so much businesses can do to "trim the fat."

    Again if you refer to the above charts, we have lots of overhead supply, MA's rolling over on larger time frames, and overall markets decelerating. Lack of breadth and leadership continues to be the theme and the previous outperformers are not participating. 


    In the end, we're at an inflection point. Either we see new market leadership and this will push us out of our most recent swoon. Or we will fail as economic conditions catch up with the deteriorating breadth/trend. 


    Comment

    Chinese Sunburn ($CSIQ #Earnings Preview)

    1 Comment

    Chinese Sunburn ($CSIQ #Earnings Preview)

    Canadian Solar (CSIQ) is set to report Q4 earnings tomorrow before the market opens with a conference call to follow at 8am ET.  

    Current Consensus stands at EPS of $0.73 on Revenue of $1.029 bln.

    CSIQ is considered to be one of the top Chinese solar players in the market. CSIQ has been a volatile name in the past and has seen aggressive selling in reaction to its last two earnings report. A positive pre-announcement on February 16 "should" take some of the earnings reaction out of play. 

    February 26 Pre-announcement

    • For the fourth quarter of 2015, Canadian Solar now expects its total solar module shipments to be in the range of approximately 1,350 MW to 1,400 MW, compared to its previous guidance, which was in the range of 1,300 MW to 1,350 MW.
    • Canadian Solar sees Q4 revs of $1.02-1.07 bln (Prior Guidance $930-980 mln) vs then-$951.21 mln Capital IQ Consensus Estimate.
    • Q4 Gross margin is expected to be above the high end of previous guidance, which was in the range of 13% to 15%.

    Previous Reactions

    • Q2 report- A $0.02 beat on the bottom line and an approximate 4% beat on the top but a fall off y/y revenue growth to 2% from 84% in Q1 was concerning. The report came on August 18 which followed the yuan devaluation and China stock market sell off. So the stock got hammered and fell to a 52-week low of $14.16 just four days later. Macro factors were at play but there was also some company-specific growth concerns.
    • Q3 Report- Co had a nice 24 cent beat on the bottom line and again outpaced revenue by approximately 5%. This resulted in a pop in the stock to $24.80 but it would quickly reverse and give up those gains. Revenue declined 7% y/y and again played a factor in the stock price. Shares then slipped to $20 and eventually held there which also corresponded with the 50 sma at the time.

    Q3 Recap

    • CSIQ reported Q3 (Sep) earnings of $0.53 per share, $0.24 better than the Consensus of $0.29. Revenues fell 7.1% year/year to $849.8 mln vs the $811.26 mln Consensus.
      • Total solar module shipments were 1,198 MW, of which 1,150 MW were recognized in revenue, compared to 809 MW recognized in revenue in the second quarter of 2015.
    • The company issued upside guidance for Q4 (Adjusted higher on 2/26), seeing Q4 revs of $930-980 mln vs. $806.27 mln Consensus Estimate.
    • CSIQ projected total module shipments in the range of approximately 1,300 MW to 1,350 MW, including approximately 170 MW of shipments to the Company's utility-scale solar projects that may not be recognized in the fourth quarter 2015 revenue.

    TECHNICAL PERSPECTIVE:

    The stock is in the midst of a recent rejection of its 200 sma (currently $23.45) on March 3. It is attempting to stabilize at its 50-sma ($21.45) ahead of its report. CSIQ promises to be one of the more volatile names tomorrow.

    1 Comment

    General, Dollar ($DG Earnings Preview)

    Comment

    General, Dollar ($DG Earnings Preview)

    Dollar General (DG) is scheduled to report 4Q15 earnings before the market opens tomorrow.

    The Street expects Q4 adj EPS of $1.26 on revs up 8% to $5.3 bln

    • Last quarter, the company guided for Q4 adj EPS of $1.23-1.28 on implied revs up 6% to $5.2 bln
    • Last quarter, the company reported EPS beat by $0.01, revs in-line, comps of 2.3%, and lowered sales, comps guidance for the full year, and the company announced an additional $1 bln to stock buyback. 

    Last Q's Guidance for FY 2015

    • Downside FY 15 comps guidance of +2.5-2.8% vs prior guidance of +3-3.5%

    • Downside FY 15 revs guidance of +8% ($19.5 bln) vs prior guidance of +8-9%

    • In-line FY 15 adj. EPS guidance of $3.88-3.93 vs $3.92 Then Cap IQ Consensus
    • Expect consistent mid-single digit growth in both units and dollars for the four-week, 12-week, 24-week, and 52-week periods
    • Expects capex to be in the range of $500-550 mln for FY15

    Guidance to Look For

    • Cap IQ Consensus estimates FY 16 adj. EPS of $4.49 on revs up 9% to $22.1 bln
    • Cap IQ Consensus estimates Q1 adj. EPS of $0.96 on revs up 6% to $5.3 bln
    • 900 new stores in 2016
    • +7% square footage growth in 2016

    Dollar Tree (DLTR) Earnings Review)

    On March 1, DG's closest peer Dollar Tree (DLTR) reported earnings that missed EPS, revs, and guided FY17 EPS below consensus. DLTR opened trading slightly down and fell as much as ~3.5%. DLTR eventually closed trading up ~2% at $82.03, the strength of the broader market could've helped the surge. The stock has sold off ~7% since 3/1. DG did spike lower on the DLTR report, but the dip was bought and the stock has been consolidating into earnings.

    Analyst Actions

    • On February 23, Buckingham Research initiated w/ a Buy; tgt $94

    • On February 16, Morgan Stanley upgraded to Overweight. 

    • On January 11, DG was under pressure from cautious Cleveland Research comments

    Technicals

    Currently, $DG is consolidating just beneath recent multi-month highs. $76 is the current resistance, and the 50 day MA is $72.


    Comment

    Urban Outfitting $URBN

    Comment

    Urban Outfitting $URBN

    Urban Outfitters Inc. (URBN) estimates are at $0.56 EPS on $1.02 billion in revenue. 

    Comparing that to last year's stats around the same time, URBN had an EPS of $0.60 and $1.01 billion in revenue. In 2016, the stock is up nearly 22% and shares of URBN are trading at $27.99/share. 

    Currently, the retailer is worth about $3.2 billion and has a massive growth trajectory worth investing in. The firm has a $30 price objective and buy rating from Bank of America’s Merrill Lynch due to its unique private third-party apparel selections. If its stock gets cheaper, private companies would be heavily interested in owning Urban Outfitters.

    Urban Outfitters has managed to shrink its float nearly 20% by buying its stock on and off for the past four years and accumulated its total earnings. 

    Monthly Comps

    • On January 7, co reported Nov/Dec net sales were flat y/y

      • Comparable Retail segment net sales increased 2% at Free People and decreased 2% at Urban Outfitters and the Anthropologie Group, respectively. Wholesale segment net sales increased 40% partially due to delayed shipments from the third quarter carrying over into the fourth quarter. Co is now current on all Wholesale segment shipments and does not anticipate any further delays.

    • On December 8, co disclosed retail segment net sales in low single digit negative

    Q3 Recap

    • URBN reported EPS in-line on revs of $825.5 mln vs then- Capital IQ Consensus of $869.6 mln. The co had already fallen through support and sold off more than 20% in the week leading up to ER. The co initially gapped down 12% in extended hours trading, and it eventually ended the day down ~4% at $21.8. The Co has been on a tear in the last month, in conjunction w/ the rest of the teen retailers, and has regained the $28 level heading into earnings today.

    • Doesn't anticipate further sales misses due to delayed shipments

    • Negative comps in retail segment resulted from decreased transaction and units per transaction; partially offset by higher ASPs
    • Traffic was down at comp stores
    • Comps by brand
      • Free People: +3%
      • Urban Outfitters: +1%
      • Anthropoplogie: flat
    • October was weakest sales comp of quarter, and co noted that it had worsened during 1H of November
    • Combined North American store traffic was down 6% YoY for quarter
    • Sees double-digit sales increases in wholesale for Q4

    Analyst Commentary

    • Robert Baird had an Outperform rating with a $29 price target.
    • RBC Capital has a Sector Perform rating with a $25 price target.
    • Brean Capital reiterated a Buy rating with a $32 price target.

    On March 3, Wunderlich reiterated its Hold rating. Wunderlich stated, "We have so far seen the teen segment face material pressure in 4Q from warmer weather, mediocre offerings, and a consumer still focused on bargains. Frankly, we believe Urban Outfitters has the potential to be impacted by all of these factors, with additional negatives from FX and weak tourist traffic. With somewhat weak initial Spring offerings, we see very limited upside and do not believe management will be optimistic in the near term; we remain on the sidelines. "

    Its analyst price target is at $26.93 today, with a 52-week trading range of $19.26 to $47.25 and over the past 52 weeks the stock is actually down about 29%. 


    REPORT


    Urban Outfitters beats by $0.05, reports revs in-line

    • Reports Q4 (Jan) earnings of $0.61 per share, $0.05 better than the Consensus of $0.56; revenues rose 0.2% year/year to $1.01 bln vs the $1.02 bln Consensus.
    • Comparable Retail segment net sales, which include comparable direct-to-consumer channel, decreased 2%. Comparable Retail segment net sales increased 2% at Free People and decreased 2% at the Anthropologie Group and 3% at Urban Outfitters. Wholesale segment net sales increased 29% partially due to delayed shipments from the third quarter carrying over into the fourth quarter.

    • "While apparel sales underperformed during the fourth quarter, I am pleased with the merchandise margin improvement delivered by the brands," said Richard A. Hayne, Chief Executive Officer. "Additionally, our expansion categories performed above our expectations and continue to give us confidence in our future growth opportunities," finished Mr. Hayne.
    • As of January 31, 2016, total inventories decreased by $28 million, or 8%, on a year-over-year basis. The decrease in total inventories is primarily related to the decline in comparable Retail segment inventories, which decreased 6% at cost and 8% in units.

    Comment

    $SHAK Attack

    Comment

    $SHAK Attack

    Shake Shack's (SHAK) current capital earnings stand at EPS of $0.07 with a revenue of $50.09 mlm.

    This stock has had its roller coaster ride, to say the least. Initially, the stock opened at $47/share and doubled to about $90/share by May 22, but had a crash by mid-July, returning back to $40/share. Subsequently, it hit an all-time-low this past February, trading for as low as $31.88/share and since then has fallen nearly 11% from February’s last IPO price.

    Will it bounce back and make a turnaround?

    Currently, its March 11 share stands at $41.50. Also, note that its short interest is about 15% of its total float, but over the past few weeks has been decreasing recognizably. Its current volatility stands at 68%, which is 5% higher than its volatility over the past month, and the stock is expected to move its price 11% in either direction.


    Key Metrics (Q3)

    • Same-store sales: increased 17.1% y/y

    • Shack sales (less revenue from licensing) in general increased 70% to $51.3 mln y/y

    • Operating profit: increased 105.7% to $15.6 mln, this represents 30.4% of sales
    • Domestic co-operated avg weekly sales: $104,000 in Q3 compared to $102,000 in Q2
    • Food & Paper costs: 29.1% in Q3 compared to 29.4% in Q2
    • Labor & Related costs: 23.7% in Q3 compared to 24% in Q2

    Updated FY15 Guidance (from Q3 earnings release)

    • Raised total rev to $189-$190 mln (vs. $171-$174 mln previously)
    • Increased same-store sales growth to between 11%-12% (vs. mid- to high-single digits previously)
    • 12 total new domestic company-operated Shacks opened in 2015
    • 6 (vs 5) international licensed Shacks to be opened under co's current license agreements in the UK, Middle-East, & Japan

    Updated FY16 Guidance (from Q3 earnings release)

    • Reaffirms total rev between $237-$242 mln vs $228.01 mln consensus

    • Same-store sales growth between 2.5%-3.0%

    • At least 14 new domestic company-operated Shacks to be opened; new stores expected to have avg annual sales volumes of at least $3.3 mln and Shack-level operating profit margins of at least 22%
    • Eight international licensed Shacks to be opened under co's current license agreements in the UK, Middle-East, & Japan

    Key executives entered into share selling plans: CEO Randy Garutti, Chairman Daniel Meyer, & Director Jeff Flug. Garutti may sell up to 80,000 shares of common stock through Aug 31, 2016, which represent ~5% of his equity holdings. Meyer may sell up to 300,000 shares of common stock through Aug 31, 2016, representing ~5% of his equity holdings. Flug may sell up to 150,000 shares of common stock through Jan 2, 2017, which represent ~9% of his equity holdings in the co.

    -Competitors Include: MCD, WEN, QSR, WING, DPZ, CMG, YUM

    Shares were down 2% before the earnings release scheduled for today.


    RESULTS


    Shake Shack beats by $0.01, beats on revs; guides FY16 rev in-line  

    • Reports Q4 (Dec) earnings of $0.08 per share, excluding non-recurring items, $0.01 better than the Consensus of $0.07; revenues rose 46.8% year/year to $51.1 mln vs the $50.09 mln Consensus. 
    • Same-Shack sales (LOL) increased 11.0% for Q4 vs. ests near +7%, on a calendar basis, versus 7.2% growth in the fourth quarter last year.

    • Co issues in-line guidance for FY16, sees FY16 revs of $237-242 mln vs. $240.54 mln Capital IQ Consensus; same shack sales +2.5-3.0% vs. estimates just above +3%; 13 new domestic Shacks and seven new licensed Shacks.

    Comment

    Jack Be Nimble $NMBL ER Preview

    Comment

    Jack Be Nimble $NMBL ER Preview

    NMBL is expected to report fourth quarter earnings tonight after the close. Consensus calls for EPS of ($0.12) vs ($0.13) last year on revenue of $88.2 mln (+29% YoY). The current consensus is within the company's guidance range of ($0.13) -- ($0.11) and revenues of $87-89 mln. 


    NMBL shares are down over 55% since it reported Q3 results when the company said there were two developments during that quarter that it believe impacted them. NMBL's investments in building out its large enterprise customer base is making progress, however these investments are taking to materialize. The second issue is the company shifted investments from commercial to large enterprise. 


    The first area of interest will be margins.


    Las quarter the company reported Q3 Non-GAAP gross margin of 66.9% vs 67.1% in the same quarter as last year. 

    The company said it believes its planned investments will improve revenue growth as well as operating leverage over time. The company expects that it will take several quarters to realize the impact of these investments and have factored that into its guidance for Q4FY16.


    Options Activity

    • Based on NMBL options, the current implied volatility stands at ~ 112%, which is 34% higher than historical volatility (over the past 30 days). Based on the NMBL March $10 straddle, the options market is currently pricing in a move of ~28% in either direction by weekly expiration (Friday).

    Technical Perspective

    • NMBL shares have outperformed the S&P so far this year with NMBL gaining by 17% vs 5% loss in the index. NMBL tends to have 4-6% reactions to earnings. On a positive report, look for resistance near the $8.4, while support sits near $7.4.


    Comment

    $COST of Doing Business

    Comment

    $COST of Doing Business

    Current COST consensus is for Q2 EPS of $1.28 on total sales +4% to $28.5 bln. February sales will be included in the earnings press release.


    Key areas of focus:

    • Comparable Store Sales: COST still provides monthly comps/sales updates and will report February sales with earnings.... The past two months' sales were lighter than anticipated with the impact from weather (Winter storm Jonas) and Superbowl shift cited. Investors will be looking for sales rebound to support this reasoning vs an actual downturn. 
    • Margins (gas deflation has large impact in these figures): COST will break out core merchandise and gas business margins during the earnings conference call. Q1 gross margin was up 26 bps at 11.29% (-6 bps excluding gas deflation). Q1 core merchandising gross margin +24 bps (-3 bps excluding gas deflation). Within the core business -- all four segments (Food/sundries, hardlines, softlines and fresh foods) saw margin expansion. Inflationary pressures and pricing are common topics in Q&A.
    • Other metrics  Average transactions and traffic data are updated during COST monthly sales pre-recorded conference calls (so actual qtrly results have minimal impact). 
    • Membership sign-ups and renewals (important leading indicator--given on conference call) : Recap from last quarter -- Q1 new membership sign-ups company-wide were +7%. Executive Membership (accounts for a third of the members base and more than two-thirds of sales in the countries where it is available) continued to benefit from good sign-ups at existing and new locations, continued increasing penetration and strong renewal rates-- averaging up ~91% in the US/Canada (nearly unchanged from Q4) and 87.8% worldwide (also near Q4 level). There has been speculation that Costco will raise its membership price at the back end of 2016 so this will also be a key topic during the conference call.
    • Expansion (may provide warehouse expansion plan during the conf call): COST FY16 CapEx estimate is $2.8-3 bln vs $2.4 bln prior year. Co operates 691 warehouses, including 488 in US and Puerto Rico, 90 in Canada, 36 in Mexico, 27 in UK, 24 in Japan, 11 in Taiwan, 12 in Korea, 8 in Australia and 2 in Spain. FY16 current plans include opening 32 net new locations. COST said last qtr that the number could come down a little bit based on timing as enter 2H. Assuming able to do open 32 -- 22 of would be in the US, 3 in Canada, 2 in Japan, 2 in Australia, 1 UK, 1 Taiwan and 1 in Spain.
    • Other hot topics: Card changes - American Express (AXP) confirmed about a year ago in February that its US co-brand and merchant acceptance agreements with Costco were set to end on March 31, 2016. COST subsequently confirmed new co-brand credit card program agreement with issuer Citi (C) and an acceptance and co-brand incentive agreement with Visa (V).Additional details were released this week. The company previously said that the transition would take several weeks- existing members with the existing co-branded cards will be getting new cards in the mail on or about the time of the actual transition. Co simply could not communicate to members about the new program until that time.


    ETFs: Consumer Staples Select Sector SPDR (XLP) -- COST accounts for ~4%, Retail HOLDRS Trust (RTH) -- COST ~5%, US Consumer Services (IYC) 2.5%, SPDR Retail (XRT) a little over 1%.


    **STATS FROM BRIEFING**

    Comment

    $HTZ #Earnings Preview

    Comment

    $HTZ #Earnings Preview

    Hertz Global (HTZ) is set to report Q4 earnings today after the close. Consensus stands at EPS of $0.05 on Revenue of $2.51 bln.

    Shares of HTZ have been obliterated over the past 18 months. The stock is down 75%  as increased competition from disruptive companies like $UBER have impacted pricing and margin while a hefty balance sheet and accounting issues have plagued investor sentiment. The industry remains under pressure as evident by the results posted by peer Avis ($CAR) on February 23. 

    Investors would like to see improving operating environment before finding an interest in this cast off name. 

    Key Metrics

    • Net Income Margin- Q3 was 8% which was an increase of over 300 bps from the prior year.

    • Worldwide Car Rental Total RPD (RPD stands for Revenue per Transaction Day)- Q3 was $46.82, down 1% y/y. Investors would like to see sequential improvement here.

    Guidance

    • On 1/13 Reaffirmed initial 2016 outlook-

    • Separation of RAC and HERC on track for mid-2016.

    • Sees EBITDA margin 16-18% in 3-5 years
    • Reaffirms FY16 HGH EBITDA $1.7-1.8 bln, HERC $625-675 mln, Hertz Global $1.075-1.125 bln.

    Fleet Refinancing

    • On February 4 HTZ announced a private offering of $1.06 bln in medium term rental car asset backed notes. This fleet refinancing removed a major overhang on the stock as there was questions on whether or not rental car companies could even obtain financing. The co no longer has any corporate debt maturing in 2016.


    Q3 Recap

    • HTZ reported Q3 (Sep) earnings of $0.49 per share, excluding non-recurring items, $0.05 worse than the Capital IQ Consensus of $0.54; revenues fell 4.6% year/year to $2.98 bln vs the $3.07 bln Capital IQ Consensus.
    • Adjusted Corporate EBITDA for the third quarter of 2015 was $601 million versus $553 million in the third quarter of 2014.
    • As a result of a 2% improvement in fleet efficiency, worldwide Revenue per Available Car Day (RACD) increased 1% despite a 1% decrease in Total Revenue per Transaction Day (RPD).
    • For the full year 2015, the co has maintained its expected adjusted corporate EBITDA guidance for Consolidated Hertz Global Holdings ($1.45-1.55 bln) and the Worldwide Equipment Rental segment. The company has lowered U.S. RAC net depreciation per unit per month, U.S. RAC fleet capacity growth and Net non-fleet capex guidance for the full year.

    Comment